Considerations for expression of fluorescent proteins and imaging in mammalian cells
Posted by Daniel Cabezas de la Fuente, on 7 July 2021
Introduction to fluorescent proteins
Fluorescent proteins have the property of absorbing light at one wavelength and emit light in a longer wavelength. These proteins were observed first in bioluminescent organisms known to humanity for centuries. We can find examples of light-emitting organisms in multiple taxa: from single cell organisms like bacteria, to vertebrates like fish.
Despite knowing of the existence of bioluminescent organisms for a long time, it wasn’t until the 1960s that their unique characteristics were studied. In 1962, Osamu Shimomura published his work studying the bioluminescent jellyfish Aequorea victoria. Two fluorescent proteins were identified in this study: the first, named aequorin, exhibited a blue glow in the presence of Ca2+ ions. The second protein was the now widely known green fluorescent protein (GFP). In A. victoria, aequorin emits blue light which excites GFP giving the overall green glow to the jellyfish1.
Once the coding sequence of the GFP gene was identified, researchers were able to express the protein in E. coli and C. elegans leading to a better understanding of the structure and function of GFP. Remarkably, GFP can fold and be fluorescent without the need of exogenous cofactors. The only requirement is the presence of oxygen. The crystal structure showed that the protein takes a characteristic shape of β-sheet-barrel. The chromophore is situated at the centre of the barrel, which protects it from quenchers.
Deciphering the sequence and structure of GFP allowed researchers to introduce modifications that altered the protein. By changing just one amino acid (S65T), Tsien and colleagues were able to generate a more stable and brighter GFP variant. The enhanced GFP (EGFP) originates from a point mutation (F64L) which increases its folding efficiency at 37 ºC2. Further mutations in the chromophore structure resulted in the generation of proteins emitting cyan, blue, or yellow fluorescence.
The discovery of GFP in jellyfish also inspired the search for new bioluminescent proteins in alternative organisms. The research carried out by Sergey Lukyanov identified a different fluorescent protein: DsRed. In this case, the fluorophore was identified in the coral Discosoma sp3. and as its name indicates, it has a fluorescence in the red-light spectrum. Further modifications of the DsRed sequence structure resulted in the widely used RFP, tdTomato and mCherry. Despite originating in different organisms and having distinct fluorescent properties, GFP, DsRed and other fluorescent proteins, have the same structure where a chromophore is encaged within a β-barrel structure.
The identification of multiple fluorescent proteins opened new possibilities for researchers studying (albeit not limited) mammalian cells. Fluorescent proteins can be used to study a great variety of cellular processes in real time. Lineage tracing, activation of cell signalling pathways, cell-cell interactions, or organelle structure and activity are some examples. Researchers need to choose the optimal fluorophore for their experimental organism and experimental conditions. Some key concepts to have in consideration about fluorophores are:
- Excitation/emission:
Although this is a very simple concept, it will have an impact on which fluorescent tag or combination of fluorophores you might want to use for your experiment and might be limited by the specifications in your instrument. The values describe the wavelengths in which a fluorophore absorbs light at a high energy wavelength and emits light at a lower energy wavelength.
The difference between the absorption and emission peaks is called stoke shift. Typically, fluorescent proteins have a separation between peaks (or stokes) of ~ 20 nm. In the case of the EGFP, the absorption peak is found at 488 nm and the emission at 508 (Figure 1 A). This means that the stokes are separated by ~ 20 nm. However, some fluorescent proteins have a wider difference: mKeima has its excitation peak at 440 nm and emission at 620 nm4, a whole 180 nm of difference (Figure 1B). These are known as large stokes shift fluorescent proteins and have practical applications in biology.
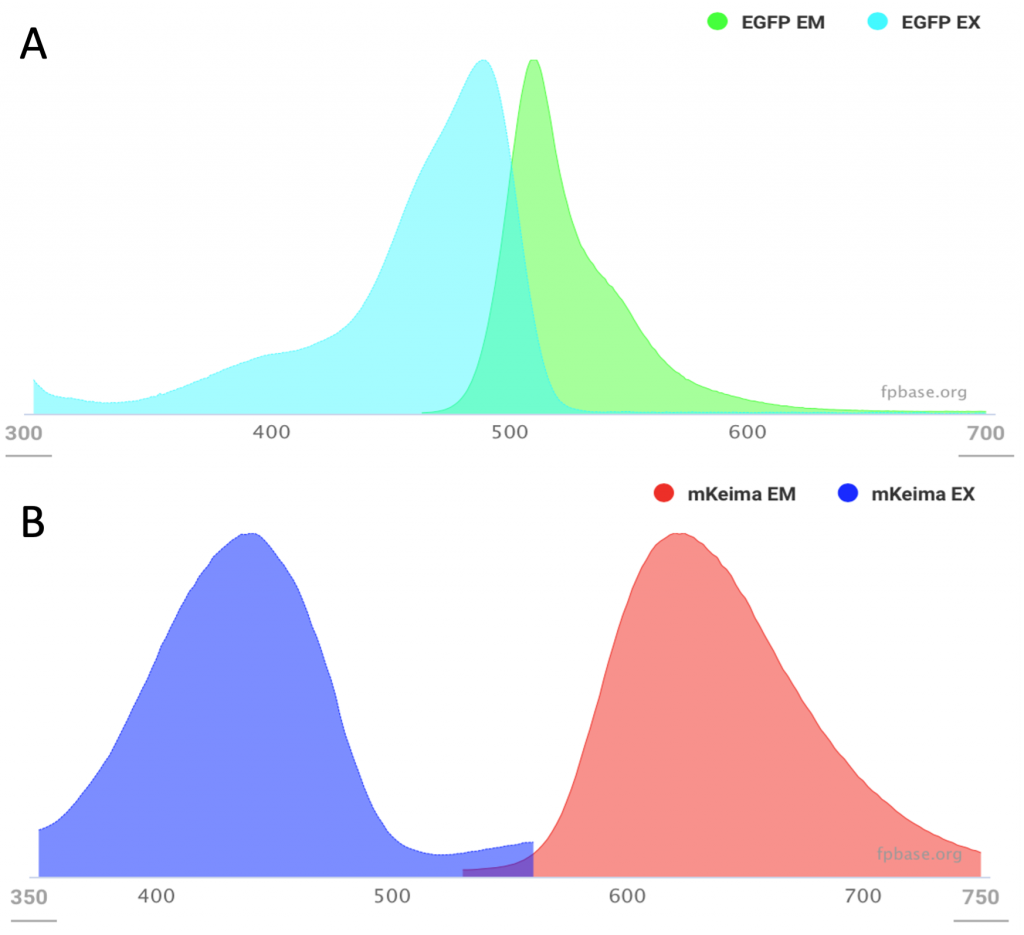
Excitation and emission of EGFP shows an excitation peak at 488nm and emission at 508nm (A) whereas and mKeima has their excitation at 440nm and emission at 620 nm (B). Images from fpbase.org.
- Extinction coefficient (EC):
Also known as molar attenuation coefficient and refers to how strongly a specimen absorbs light at a given wavelength.
- Quantum yield:
In fluorescence, quantum yield is the ratio between the number of emitted photons to the number of photons absorbed. The values range between 0 and 1.0 although it can be expressed in the form of percentage. A fluorophore with a quantum yield of 1.0 indicates that a photon is released for each one that is absorbed.
- Brightness:
This is an important characteristic of a fluorescent molecule as it defines the intensity of the fluorescence and thus, the amount of signal captured by your instrument. The theoretical brightness of a fluorophore can be computed by multiplying their extinction coefficient (EC) by their quantum yield (QY) times 1000. This measurement is usually normalised against EGFP, where EGFP brightness = 1. As informative as this measure is, it assumes ideal conditions which might differ in your experimental design.Practical brightness includes variables from your experiment that will have an impact in the fluorescent protein of choice and is measured empirically. This factors in events like protein folding, maturation time, stability, formation of aggregates, or intrinsic brightness. These can have an impact to the degree of expression and brightness of your protein and thus, your ability to detect any signal.
Expression of fluorescent proteins in mammalian cells
Both transient and long-term expression of fluorescent proteins can be achieved in mammalian cells. Exogenous DNA containing the coding sequence for a fluorescent protein can be introduced in the cells via several approaches. Some examples are transduction with viral vectors, transfection using liposomes or incorporation via electroporation. Different strategies will produce different outcomes: transfection tends to lead to transient expression of the fluorescent protein since the exogenous DNA is diluted more and more as the cells divide. On the other hand, lentiviral vectors integrate the genetic material in the genomic DNA of the host cell, which leads to a maintained expression of the fluorescent protein.
The degree of expression of the protein will have an impact on the signal acquired and the biology of the cells. Since proteins in cells are expressed in specific dynamic ranges, deviation from these can alter the homeostasis of the cells and cause an abnormal phenotype. For example, overexpression of a fluorescently tagged protein under a constitutive strong promoter, such as CMV, might cause an undesired phenotype or lead to the formation of toxic protein aggregates. Moreover, fluorescent proteins can cause phototoxicity, which can alter the normal biology of the cells and lead to cell death. A more detailed explanation and strategies to deal with phototoxicity is included further down in this guide.
Temporal expression of a fluorescent protein can also be achieved by introducing the sequence for the fluorophore under a specific promoter or linked to a certain protein. This allows to study dynamic changes in the cells such as endoplasmic reticulum stress, activation of cellular pathways or identifying a particular phase of the cell cycle.
Reporter genes
If your goal is to study changes in cells or protein expression under controlled conditions, the best method would be to obtain a degree of expression similar to that of your protein of interest. This can be achieved by introducing a DNA sequence that codes for your fluorescent protein directly controlled by the promoter of the protein of interest (Figure 2A).
Because of its simplicity of use, random integration of constructs using lentiviral vectors is also a commonly used strategy. This is an acceptable approach for an end-point experiment. This approach would not be appropriate if you want to generate a cell line such a pluripotent stem cell line. If the exogenous DNA sequence is inserted near an oncogene instead of a safe harbour, like the AAVS1 in humans or the ROSA26 in mice, could cause an abnormal phenotype in these cells.
Using CRISPR/Cas9 technology, exogenous DNA sequences can be introduced in very specific points reducing the likelihood of unwanted effects. For instance, the coding sequence can be directed to be inserted in frame at the 5’ or 3’ of the gene of interest (Figure 2B). This strategy can be used to measure the abundance and sub-cellular localisation of a protein of interest, for example, fusing EGFP to TOMM20 to fluorescently label the mitochondria. Including a self-cleaving sequence (such as the T2A) will cause the ribosome to generate two separate peptides from the fluorescent tag and the protein of interest achieving a 1:1 expression (Figure 2C).
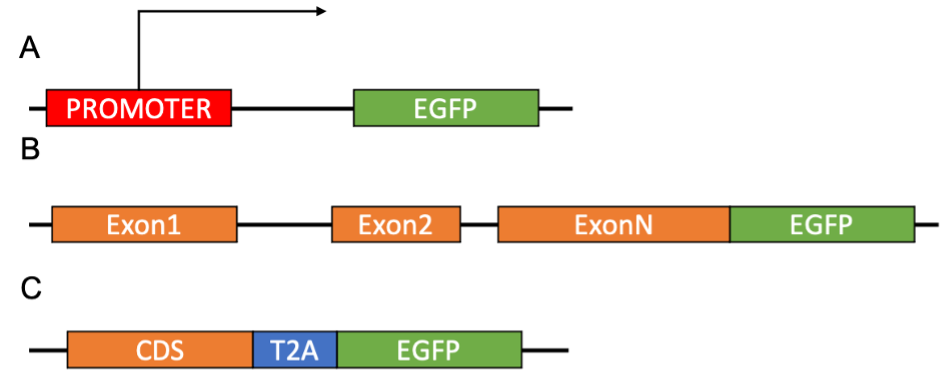
A) Expression of the fluorescent protein is directly controlled by a promoter of interest. B) The coding sequence for the fluorescent protein is inserted in frame with the gene of interest to generate a fusion protein. C) The sequence for the fluorescent protein is inserted in frame with the coding sequence with the gene of interest separated by a self-cleaving T2A sequence generating two separated proteins.
Autofluorescence and phototoxicity
Background noise and autofluorescence
Both background noise and autofluorescence present similar challenges for microscopists making it difficult to obtain clean and reliable images. Both often have similar origins: growth media, sample preparation or microscope slides are some of the common origins of these artefacts5.
Cells are typically grown in cell media containing bicarbonate buffers in order to maintain physiological pH levels. This is important to preserve the biology of the cell as well as maintaining the brightness of any fluorophores present in the samples. However, this means that it needs a continuous presence of CO2 to maintain physiological pH as the media will become rapidly basic outside the incubator. Many fluorescent proteins are pH sensitive and will reduce their brightness if the conditions are too acidic or basic. Lower brightness will cause a weaker signal making it harder to distinguish it from background noise.
Cell media is also a source of autofluorescence. Phenol red is commonly used in cell media, which is highly fluorescent at wavelengths around 440 nm. If the aim is doing live-cell imaging, one should consider using clear imaging media. Different media formulations without phenol red and sodium bicarbonate that can help reduce the background signal in the samples: OptiKlear, distributed by Abcam, and FluoroBrite DMEM from ThermoFisher, are excellent alternatives formulated for live-cell imaging. Other cell media components such as riboflavins, acid folic or FBS as well as some small molecules and drugs can exhibit autofluorescence.
The simplest way to avoid autofluorescence is knowing the range of the spectrum in which it localises. For example, in my cell cultures I tend to observe high autofluorescence in my samples in the blue spectrum, and that’s why I prefer choosing green fluorescent proteins over blues (Figure 3). If your microscope has been set up to work on the far-red and near infra-red (NIR) spectrum, it’s preferable to work on this range as the autofluorescence levels are generally lower.
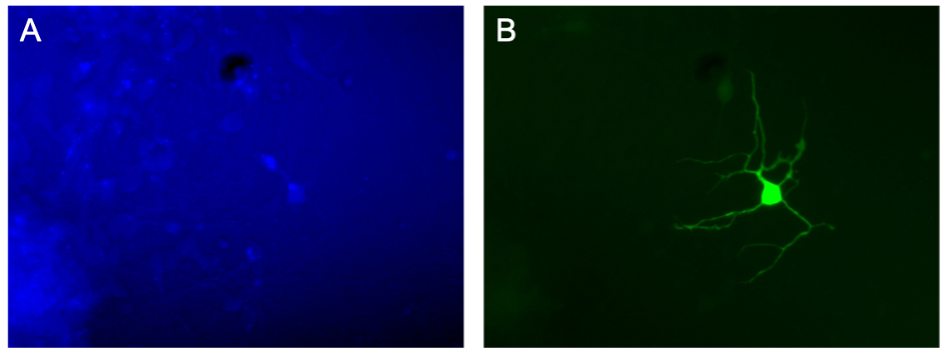
In vitro culture of cortical glutamatergic cells co-expressing TagBFP2 and mNeonGreen. The same field of view was imaged in the blue (A) and green (B) channel. The blue channel shows high levels of autofluorescence making it impossible to distinguish the TagBFP2. In contrast, the green channel clearly shows the positively labelled cell with mNeonGreen.
Computational approaches can also be applied to remove the autofluorescence signal from acquired images. CellProfiler and ImageJ are freely available software that incorporate methods for subtracting autofluorescence from the images6,7. Users can also take advantage of deep learning for processing images. Furthermore, the development of neural networks such as CARE or Noise2Void facilitate the removal of unwanted noise in microscopy images 8,9. However, these methods can be computationally expensive and different algorithms should be tested to see which one performs best for your sample.
Other advanced microscopy methods involve using white light lasers. This type of illumination device allows to finely tune the excitation wavelength to best match that of the fluorophore. And since they work with all wavelengths of the visible spectrum, they can excite far red fluorophores which are better suited to avoid autofluorescence.
Phototoxicity
Phototoxicity is the phenomenon in which cells exposed to a light source suffer from damage which can lead to cell death. Different organic molecules present in the cell can absorb light which, when reacting with oxygen, causes degradation of these molecules. Consequently, the process generates reactive oxygen species (ROS)10. Additionally, fluorescent proteins and probes can also react with molecular oxygen generating more ROS. Oxygen radicals can react with DNA, proteins, fatty acids and cofactors altering the stability of the sample.
This is particularly important when imaging live samples over extended period of time. Recursive phototoxicity damage can change the biology of your cells and alter the results of your experiment and because not all samples present the same sensitivity to photodamage, testing their sensitivity should be implemented as part of the experimental process. Moreover, including strategies to reduce the damage originated from imaging, would ensure acquiring more reliable and reproducible data.
The easiest way to reduce phototoxicity in living samples is by reducing the intensity and increasing exposure time. Because ROS are produced in a smaller quantity over a long period of time, the physiological mechanisms are able to buffer them reducing their detrimental effects. This comes at the expense of reducing the signal-to-noise ratio (SNR) and it’s why selecting the adequate fluorescent protein or fluorophore matters. Using a brighter fluorescent reporter in a particular experimental condition, can help reduce the intensity and exposure time whilst maintaining a high SNR and thus, ensuring the stability of the sample.
Generally, imaging under longer wavelengths is better at maintaining the integrity of the live sample. This is because longer wavelengths are less energetic than short wavelengths. Therefore, fluorescent proteins in the red and NIR spectrum are more suitable for live imaging. Although these proteins on the far end of the visible light spectrum are less bright compared to green, red and yellow proteins. Nonetheless, researchers are constantly developing brighter versions of red-shifted fluorescent proteins. Good examples are iRFP720 and its monomeric version miRFP720, which exhibit a high SNR in the NIR spectrum11,12. Another advantage of NIR proteins is they are more suited for working with thicker tissue or animals because red light shows less diffraction across tissue.
Choosing the adequate type of microscopy for your experimental design can be beneficial when working with living samples. Confocal microscopy gives high resolution images with a very robust background because only one focal plane is illuminated. However, this kind of microscopy requires high intensity power and long exposure times which leads to photobleaching and phototoxicity. If high resolution is not required, widefield microscopy can alleviate the effects of phototoxicity. In widefield, all focal planes are illuminated resulting in higher emitted fluorescence and therefore, requires shorter exposure times with lower laser intensities compared to confocal. Similarly, the binning choice during acquisition can help reduce the light intensity and exposure. For instance, a 2×2 binning takes a 4-pixel area to generate one pixel. This results in higher SNR ratio using lower laser intensity at the expense of resolution.
Finally, even if the general aim is to preserve the integrity of the samples, researchers can use the intrinsic properties of fluorescent proteins for generating ROS to study how cells respond to this kind of stimuli. KillerRed and miniSOG (mini Singlet Oxygen Generator) have been optimised to generate photo-induced cytotoxicity when exposed to red and blue light respectively.
Summary
This guide represents the essential knowledge necessary for a researcher who wants to start working with fluorescent proteins. Although the guide is focused on mammalian cells, the concepts can be applicable to other models used in research.
Fluorescent proteins are a versatile system to study the biology of cells. They can be expressed on their own, co-expressed with proteins of interest or used to tag proteins to identify their abundance and sub-cellular localisation. There are multiple strategies to express fluorescent proteins in mammalian cells. Researchers need to identify the method that is most adequate for their experimental design.
Knowing the properties of the fluorescent protein of choice as well as the sample, is the best way to avoid autofluorescence or other undesired effects derived from the imaging. Nonetheless, there are approaches to overcome the negative impact of fluorescence imaging on living cells. Taking all of these into consideration can help produce high quality images and data whilst preserving the integrity of the cells.
References
1. Shimomura, O., Johnson, F. H. & Saiga, Y. Extraction, Purification and Properties of Aequorin, a Bioluminescent Protein from the Luminous Hydromedusan,Aequorea. J. Cell. Comp. Physiol. 59, 223–239 (1962).
2. Kilgard, R., Heim, A. B. & Tsien, R. Y. Improved green fluorescence. Nature 373, 663–664 (1995).
3. Matz, M. V. et al. Fluorescent proteins from nonbioluminescent Anthozoa species. Nat. Biotechnol.17, 969–973 (1999).
4. Kogure, T. et al. A fluorescent variant of a protein from the stony coral Montipora facilitates dual-color single-laser fluorescence cross-correlation spectroscopy. Nat. Biotechnol. 24, 577–581 (2006).
5. Background in Fluorescence Imaging – UK. Available at: https://www.thermofisher.com/uk/en/home/life-science/cell-analysis/cell-analysis-learning-center/molecular-probes-school-of-fluorescence/imaging-basics/protocols-troubleshooting/troubleshooting/background-fluorescence.html. (Accessed: 18th June 2021)
6. Schindelin, J. et al. Fiji: an open-source platform for biological-image analysis. Nat. Methods 9, 676–682 (2012).
7. McQuin, C. et al. CellProfiler 3.0: Next-generation image processing for biology. PLOS Biol. 16, e2005970 (2018).
8. Weigert, M. et al. Content-aware image restoration: pushing the limits of fluorescence microscopy.Nat. Methods 15, 1090–1097 (2018).
9. Krull, A., Buchholz, T.-O. & Jug, F. Noise2Void – Learning Denoising from Single Noisy Images. (2018).
10. Kiepas, A., Voorand, E., Mubaid, F., Siegel, P. M. & Brown, C. M. Optimizing live-cell fluorescence imaging conditions to minimize phototoxicity. J. Cell Sci. 133, (2020).
11. Shcherbakova, D. M. & Verkhusha, V. V. Near-infrared fluorescent proteins for multicolor in vivo imaging. Nat. Methods 10, 751–754 (2013).
12. Shcherbakova, D. M., Cox Cammer, N., Huisman, T. M., Verkhusha, V. V. & Hodgson, L. Direct multiplex imaging and optogenetics of Rho GTPases enabled by near-infrared FRET. Nat. Chem. Biol.14, 591–600 (2018).
 (No Ratings Yet)
Write a ‘How to’ post
Create an account or log in to post your story on FocalPlane.
More posts like this

Filter by
- NewsApply
- DiscussionsApply
- How toApply
- ToolsApply
- Case studiesApply
- InterviewsApply
- JobsApply
- EducationApply
- Blog seriesApply
- Latin America Bioima..gingApply
- From Zero to Qupath ..HeroApply
- Asian Microscopists ..and Cell BiologistsApply
- AIC at HHMI JaneliaApply
- Deep Learning for Bi..o-image analysisApply
- GloBIAS – updates fr..om the communityApply
- WAMBIAN: West Africa.. in FocusApply
- Volume EMApply
- Latin American Micro..scopistsApply
- Bio-image Analysis w..ith NapariApply
- Imaging with…Apply
- Towards Global Acces..sApply
- Highlights from Euro..-BioImagingApply
- LSFM seriesApply
- DIY MicroscopyApply
- View all