LSFM series – Part IV: Data post-processing: Cropping, tailoring, and trimming
Posted by Elisabeth Kugler, on 23 January 2021
Elisabeth Kugler 1 and Emmanuel G. Reynaud 2
Contact:kugler.elisabeth@gmail.com; emmanuel.reynaud@ucd.ie
There is a very thin sheet of light between gathering data and hoarding. In Science, between pilling up manuscripts on desk, books on shelves and samples in cold freezer, most of us fit in the latter category. It is OK, if you have space available and you can still reach the door and decipher the twenty lines of Egyptian hieroglyphs on the 0.5ml vial. Even though, data storage Clouds and hard drives are cheap these days it is not worth it gathering data which have no scientific value at all. In LSFM, it is easier than ever to shovel Terabytes of data on a computer within hours and as it is possible to image for days the problem grows exponentially. So yes, it will be painful but this fourth part deals with being resilient and letting things go!
- Check it!
Typically, we do not check data on the spot. We let them mature for a couple of days or even months, sometimes years before analysing them. This is very very dangerous, especially in LSFM context. It is simple after acquiring data to perform a simple quick check! Often you record a stack but biological samples do move or the reporter starts flickering or bleach. So, visually assessing data quality by sliding through the stack will help you spot issues, complementary Z-projection will identify alignment artifacts, and a X-or-Y projection may show you additional data challenges. This is particularly an essential step for time-lapse data, as samples often grow out of the field of view (FOV), drift or vanish into the darkness by bleaching. To delete one stack removes just a few Gb, but time-lapses often account for Tb and if the sample dies mid-way, the data are useless apart for demonstrating issues. Do not think the Dalek will invade Earth and provide you with the technology to rescue those data. DELETE! DELETE! DELETE! So do not chance it! Check it!
2. Useless pixels must go.
Removing useless pixels is key to reducing data size. This starts with ensuring sample alignment with respect to sample geometry (see also Part II; Fig. 1A, B), which allows for reduced image/stack size and enables acquisition at various angles, producing images that can be digitally fused later to improve axial resolution as well as isotropy (see also Part III).
Next, image only what you need by making use of zoom (digital: cropping with reduced resolution; optical: enlarges the images, while keeping resolution) and, if needed, cropping in post-processing can reduce the data load (Fig.1C, D). However, this must be tailored to your sample and its needs, especially over time (growth, movement, bleaching, …) and it must be kept consistent across a series of samples to avoid scaling issues during analysis.
Consider what image properties you really need (e.g. bits, voxel size, voxel number, z step size, etc.), and at which points you could potentially down-sample your data for further processing (e.g. (x,y) 1920 x 1920 to 512 x 512; and/or (z) 700 to 350). If you are tempted to keep and store your data in full scale, thinking about compressed storage (e.g. «zipping») or using file containers (e.g. «hdf5») might be an option to reducing the data load and easing data handling challenges. Beware of your storage solution and the way data is being transferred.
Together, all these steps help to surf the data freak wave and not being buried under terabytes of (superfluous) data (Fig. 1E).
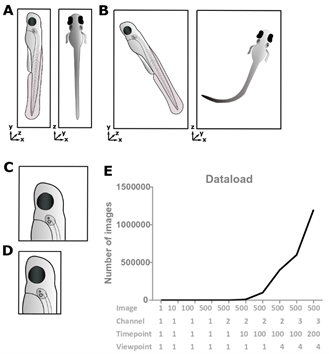
Figure 1: Useless data must go.
(A, B) Ensure optimum sample alignment with respect to sample geometry, as this can significantly affect data size as well as the physical space the light must penetrate. (C, D) Using the right magnification and zoom can decrease the data load by removal of “useless” background data. (E) Data load increases exponentially with the number of images, channels, time-points, and viewpoints.
3. Data handling
Data acquired with LSFM are often in the range of terabytes, with data acquisition over time or multiple colours adding complexity. Investing thought and money in data storage and backup will strongly benefit intelligent data flows. E.g. consider how raw and processed data will be stored; or whether a server, hard drives, or a cloud-based solution are implementable and sustainable. Nowadays, it is a primary importance to have a data management plan in place. You should discuss with colleagues and line managers as data management can easily amount to a third of the cost related to imaging. It is not unusual to have groups establishing dedicated server systems above 64Tb to be able to handle data. Depending on your institutions guidelines, you may have to store those data for more than 10 years, so compression is worth it but also looking into data storage solutions including cold storage systems (tape). You MUST remember that collecting data is the first steps as you need to analyse them creating additional subsets of processed datasets. Do not process directly raw data, make a duplicate! So, if you are reading this paragraph, have a think on how your data flow is running and how to handle your data beyond the next week of experiments, but the coming months/years and make sure it is doable. Nothing is worse than to run to the nearby computer store to buy an extra HD in a panic or crushing somebody else data because you need space!
Similarly, a file type convention can be beneficial, eg. do you store your data as. czi or .tiff, or will you share .svg or. png’s?
It sounds simple, yet many of us are guilty of not following file naming conventions, making data less identifiable and retrievable. One approach could be for example: folder name «ddmmyyyy_age_strain_fluorophore_experiment_repeat», file name «age_strain_sample_direction», notebook «date, experimental details, storage location (eg Server X or Hard drive Y), accompanying files, additional comments».
Filename do’s: use underscores, CamelCase, sequences, extensions (Fig. 2).
Filename dont’s: spaces and dots (the analyst’s enemy), inconsistency in sequences (1, a, 2, good, again – you WON’T remember), being unspecific.
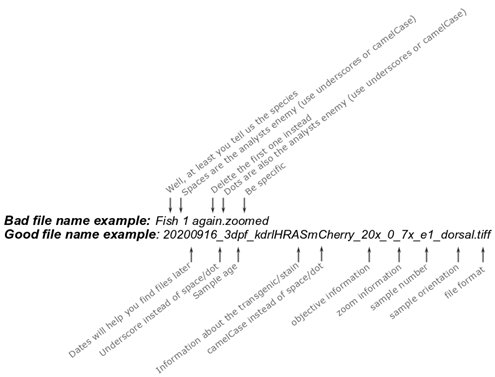
Figure 2. Filename example.
Together, even though data management plans are often applied, yet handling and finding data can be very challenging.
4. Growing with Data Challenges
https://fiji.sc/As data analysis needs grow with data size (for data storage check part V) and desired extracted quantifications, box-standard analysis approaches are often impossible to simply being applied to data. Thus, dedicated analysis methods are often developed to answer specific data needs. To achieve this, community efforts are needed, exemplified by NEUBIAS, MICCAI, and further developments of the non-commercial image analysis software “Fiji is just ImageJ” (FIJI).
The way software development has rose to the data challenge is furthermore exemplified by specifically developed tools to handle large data sets, such as the “BigStitcher”, “Big Data Viewer”, or “Mastodon” in Fiji.
5. DELETE, DELETE, DELETE
There is only so much data processing can achieve! In image processing we want to extract useful, often quantitative, information from the data we acquired, and even though there is a lot that can be done, bad data is trash data and in the worst case delivers meaningless or even wrong results.
Your imaging data are naturally compromised by imaging artefacts such as
- Noise: e.g. shot or Poisson noise
- Background: one type of noise which can be particularly challenging in fluorescence microscopy e.g. due to auto-fluorescence
- Point-spread-function (PSF): the systems response to a point source. This response can be far (very far!) away from the ideal (theoretical) one.
- Optical path decay: e.g. uneven excitation and drifting.
- Acquisition artefacts: such as shadowing or stripe artefacts
Similarly, if you have time-lapse data and your sample dies during the acquisition, how meaningful are the data you acquired? i.e. isn’t it likely that cellular changes towards death happened long before you can see them?
Even though it can be painful to hit the delete button, it is unlikely that you will go back to these data.
Together, it becomes clear that meaningful data processing depends on meaningful data, which are produced by optimum sample alignment, x,y,z-dimensions, and imaging settings. To bridge the gap between experimental and computational scientist, good practices of data handling/storage and interdisciplinary communication are needed.
May the LISH be with you,
Elisabeth and Emmanuel
P.S.: If you want to share your views, do not hesitate to get in touch.
Acknowledgements
We thank Francesco Pampaloni and Robert Haase for their free advice and insights.
Associations / Institutes
(1) Institute of Ophthalmology, Faculty of Brain Sciences, University College London, 11-43 Bath Street, LondonEC1V 9EL. (2) School of Biomolecular and Biomedical Science, University College Dublin, Belfield, Dublin 4. Ireland.
 (No Ratings Yet)
Get involved
Create an account or log in to post your story on FocalPlane.
More posts like this


Filter by
- NewsApply
- DiscussionsApply
- How toApply
- ToolsApply
- Case studiesApply
- InterviewsApply
- JobsApply
- EducationApply
- Blog seriesApply
- Volume EMApply
- Latin American Micro..scopistsApply
- Bio-image Analysis w..ith NapariApply
- Imaging with…Apply
- Towards Global Acces..sApply
- Latin America Bioima..gingApply
- From Zero to Qupath ..HeroApply
- Asian Microscopists ..and Cell BiologistsApply
- AIC at HHMI JaneliaApply
- Deep Learning for Bi..o-image analysisApply
- GloBIAS – updates fr..om the communityApply
- WAMBIAN: West Africa.. in FocusApply
- Highlights from Euro..-BioImagingApply
- LSFM seriesApply
- DIY MicroscopyApply
- View all