From Click to Code: Reproducibility in Bio-image Analysis
Posted by Mara Lampert, on 5 August 2025
Reproducibility is at the heart of good science. But when it comes to bio-image analysis, it can feel difficult to achieve. Complex datasets, shifting software environments, and countless manual tweaks often make it hard to retrace your own steps and share workflows with others. An aim should be to package the entire analysis, like code, data and environment, in a way that anyone (including future you) could easily run and understand. In this post, we’ll explore different ways how and why to save bio-image workflows for reproducibility.
Exporting workflows from GUI tools
Graphical user interfaces (GUIs) make image analysis more intuitive and accessible, but they also come with a hidden risk: the steps we take aren’t always fully documented or easy to reproduce. To make sure your analysis can be shared, repeated, or even automated later, it’s essential to save your workflows in a structured way. In the following sections, we’ll look into this across several popular platforms, including Napari, Fiji, QuPath, Galaxy, CellProfiler and JIPipe.
The napari-assistant
Napari is an interactive, multi-dimensional image viewer that supports a rich ecosystem of plugins for bioimage analysis. One particularly useful tool for making napari workflows reproducible is the napari-assistant. It is a plugin to build image processing workflows. To start the napari-assistant, you need to install at least one other napari plugin that uses it as user interface. Afterwards, you can select the napari-assistant from the menu Tools > Utilities > Assistant (na) or just type naparia in the command line. Next, you will see an overview of clickable tiles (marked in above screenshot in violet). Each tile represents a typical image analysis pipeline step. By clicking the different options from left to right and top to bottom, we can easily assemble a pipeline. More detail on this can be found here.
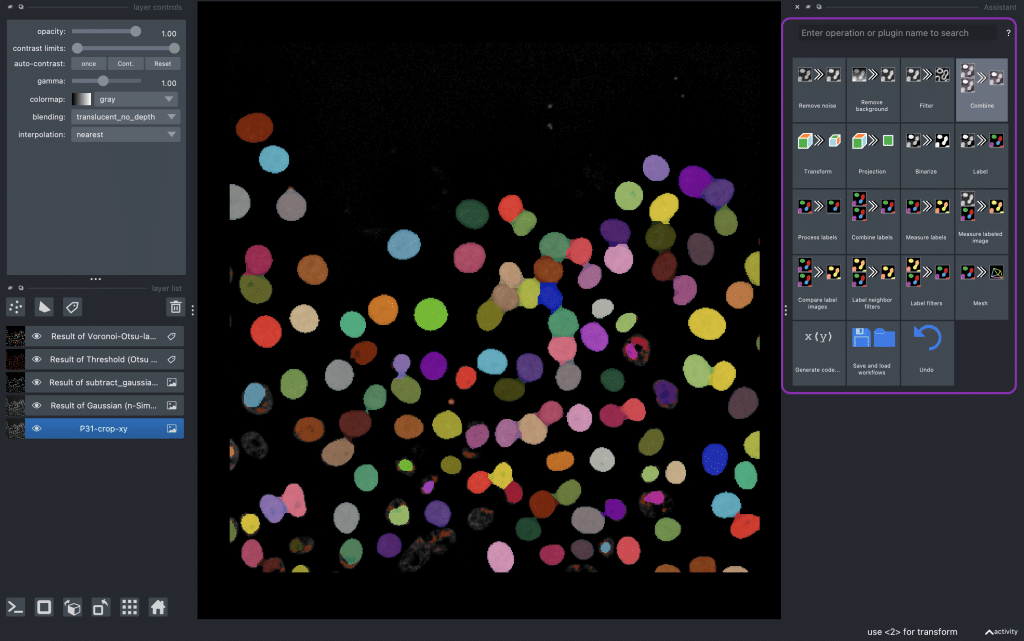
The image that we are using in this blog post is a crop of the cancer cell migration dataset by Jean-Yves Tinevez and Guillaume Jacquemet licensed CC-BY 4.0.
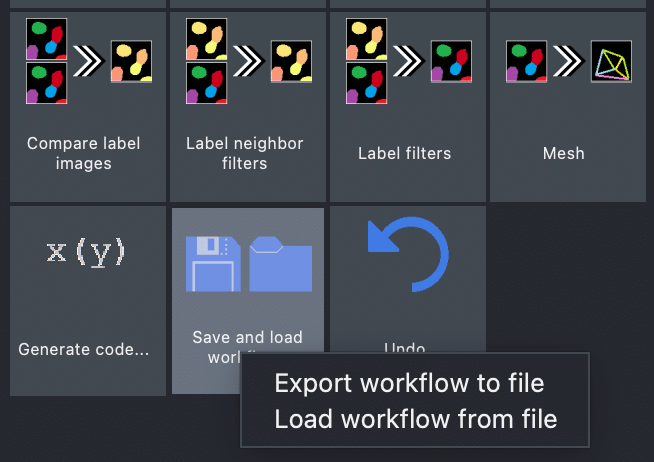
Once you are happy with your workflow, you can save and load it to disk:
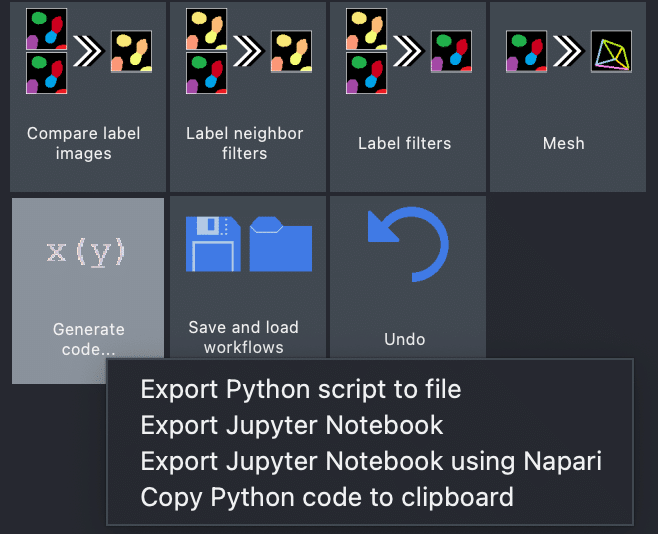
Furthermore, the napari-assistant allows exporting the given workflow as a Python script and Jupyter notebook, which allows to easily save your workflow and execute it again later:
This step is also explained in more detail here. The napari-assistant uses under the hood napari-workflows. If you are interested in utilising this backend, you can dive deeper here.
Fiji
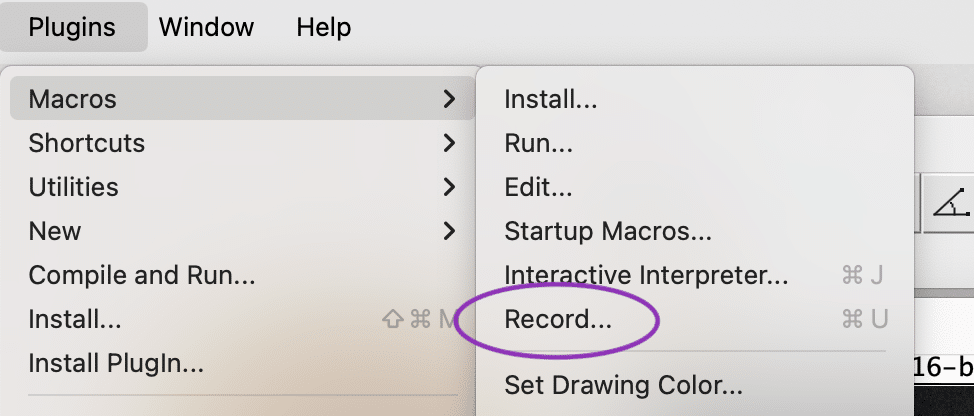
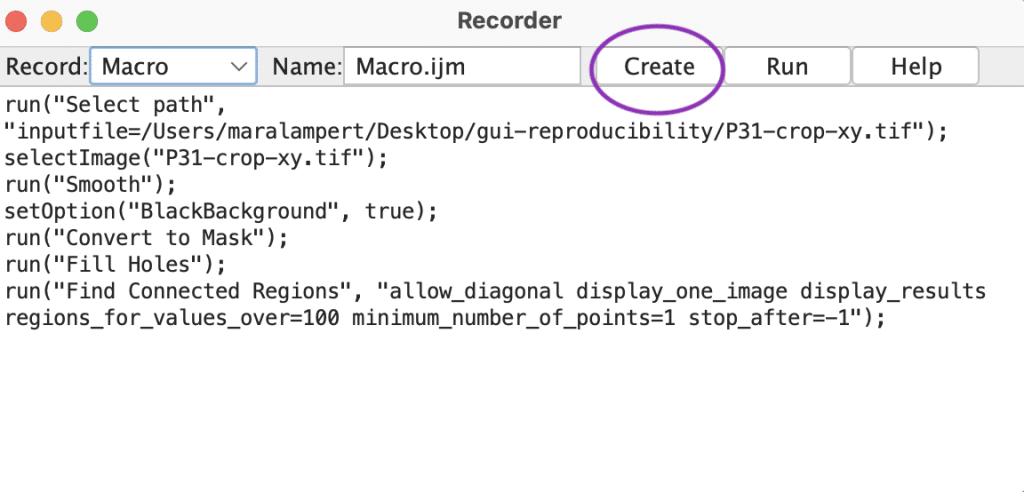
While napari is rapidly growing, Fiji is one of the most established platforms for bio-image analysis. It provides a built-in macro recorder that automatically logs your actions as you use its GUI:
- Go to
Plugins > Macros > Recordto open the Macro Recorder window.
- Perform your desired image analysis steps, such as opening an image, applying filters, thresholding, or measuring objects.
- Once you’ve completed your workflow, click
Createto export the recorded steps as a macro file
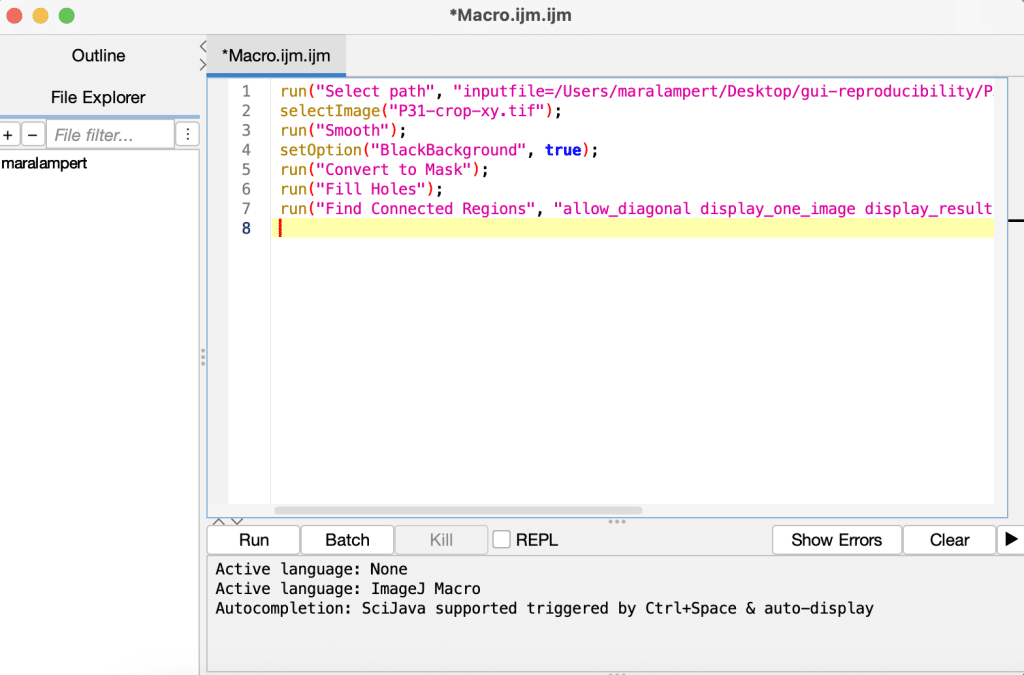
This macro can be reused on other images, shared with collaborators, or version-controlled. You can also edit the macro later to fine-tune or automate specific parameters.
QuPath
QuPath is another great open-source platform that can be used to create and save your bio-image analysis workflows. If you don’t know QuPath yet, here is a helpful workshop to get started. QuPath utilises workflows which do not only represent the commands that are run, but also used parameters.
Hereby, QuPath automatically logs commands that are run in a Command history. Let us open the Workflow tab of the Analysis panel on the left:
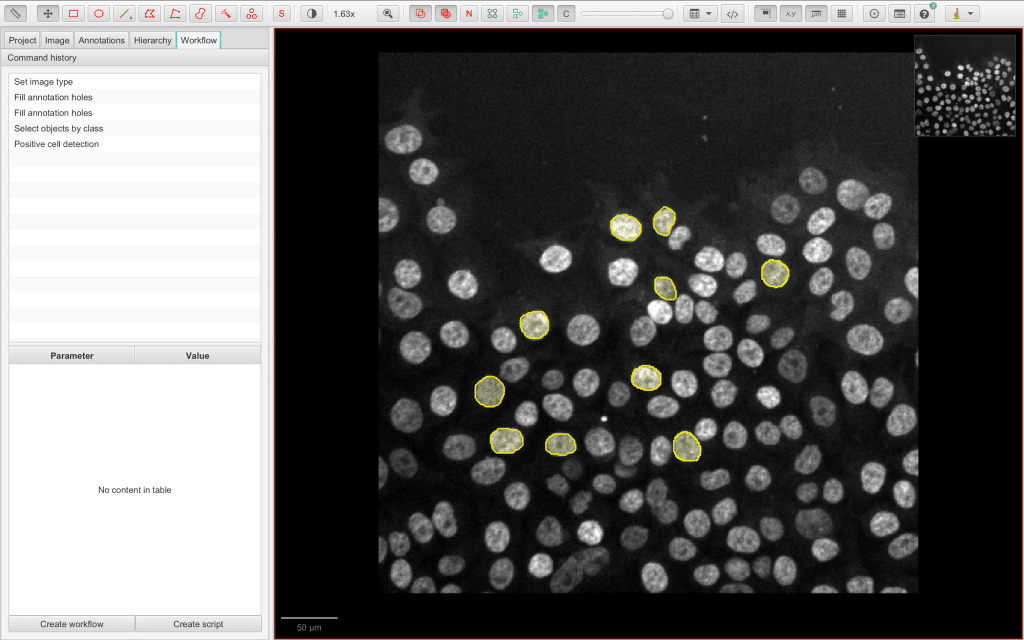
Below the Command history is a button Create workflow. It can be used to create a new workflow based on the Command history with the advantage that this new workflow can be edited:
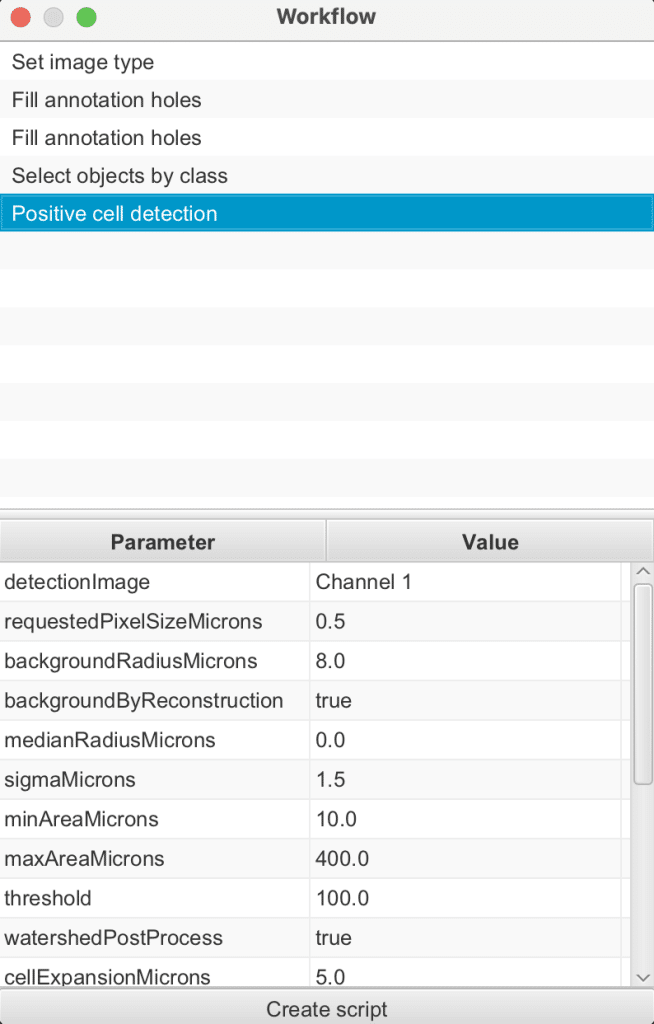
Command history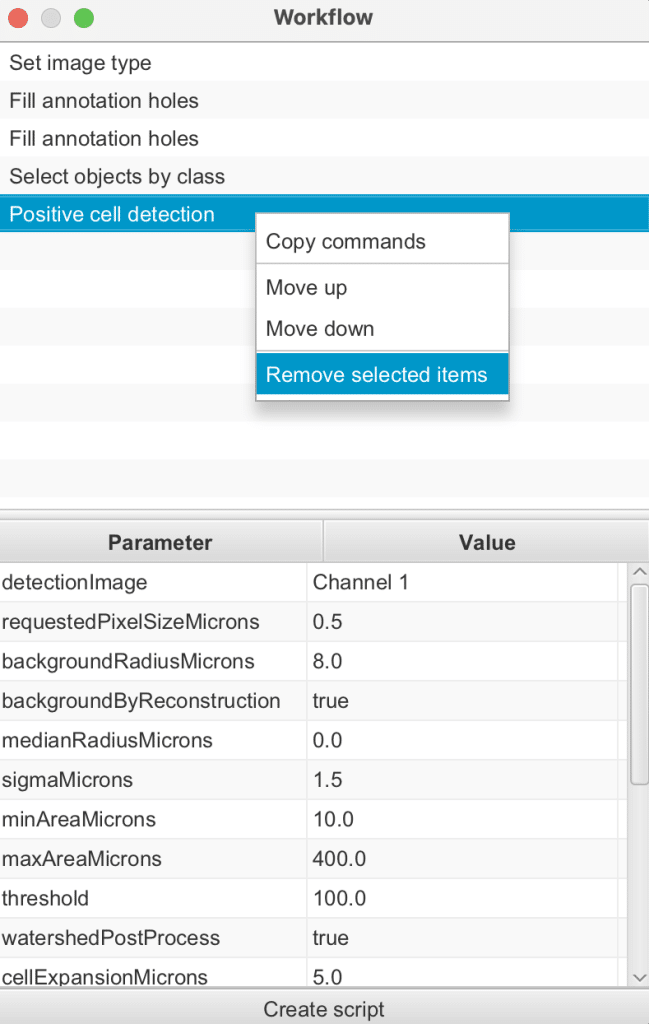
Galaxy
In contrast to the tools mentioned so far, Galaxy is a web-based platform for data intensive biomedical research. It offers the ability to arrange your bio-image analysis workflow in modules which makes it easier to keep an overview. As an example, let us look at the workflow Segmentation and counting of cell nuclei in fluorescence microscopy images (release v0.2) – Version 1 by Leonid Kostrykin under MIT-License:
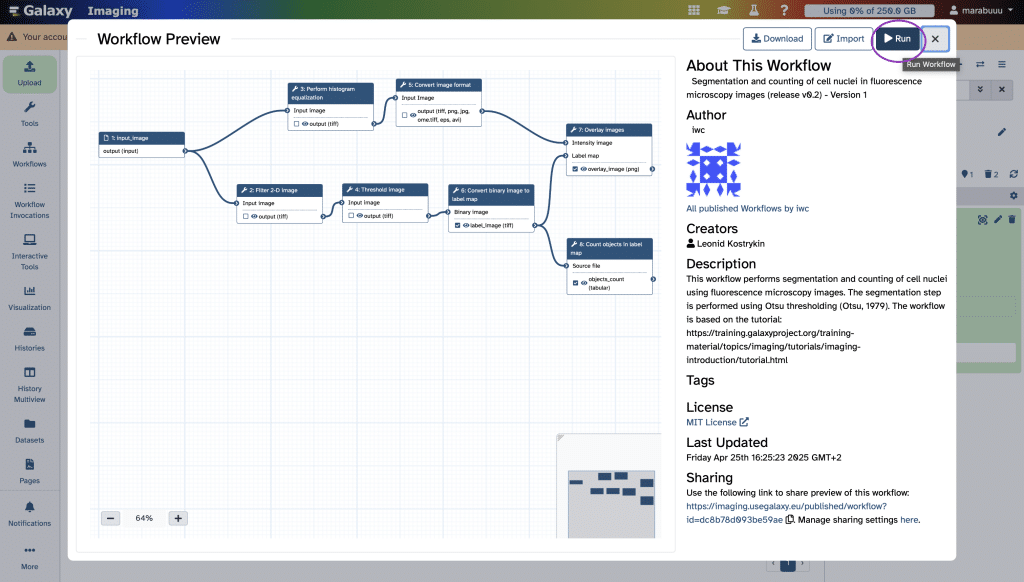
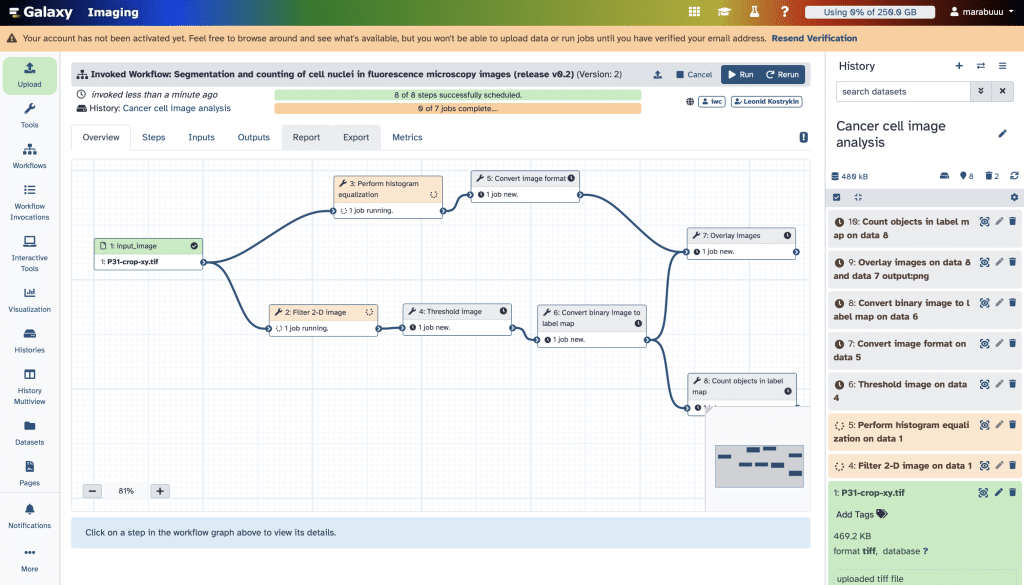
Like in QuPath, Galaxy also has a History panel which can be found on the far right, base color light blue. If we click on Run, the different steps of this workflow are appended to our history. In green, we can see all pipeline steps that were already executed and in orange the ones that are currently carried out.
If we are building our own pipeline by arranging modules in our history, we can open the History menu and scroll down to Extract Workflow:
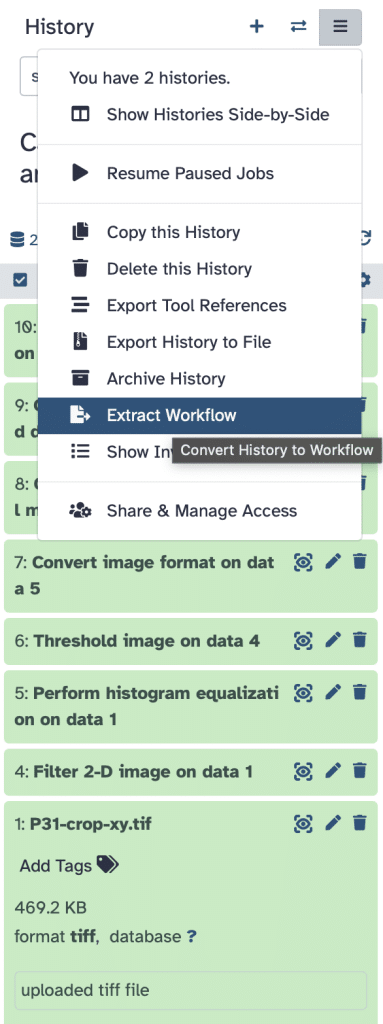
Now, we can modify some parameters before workflow creation as also specified here and then press Create Workflow:
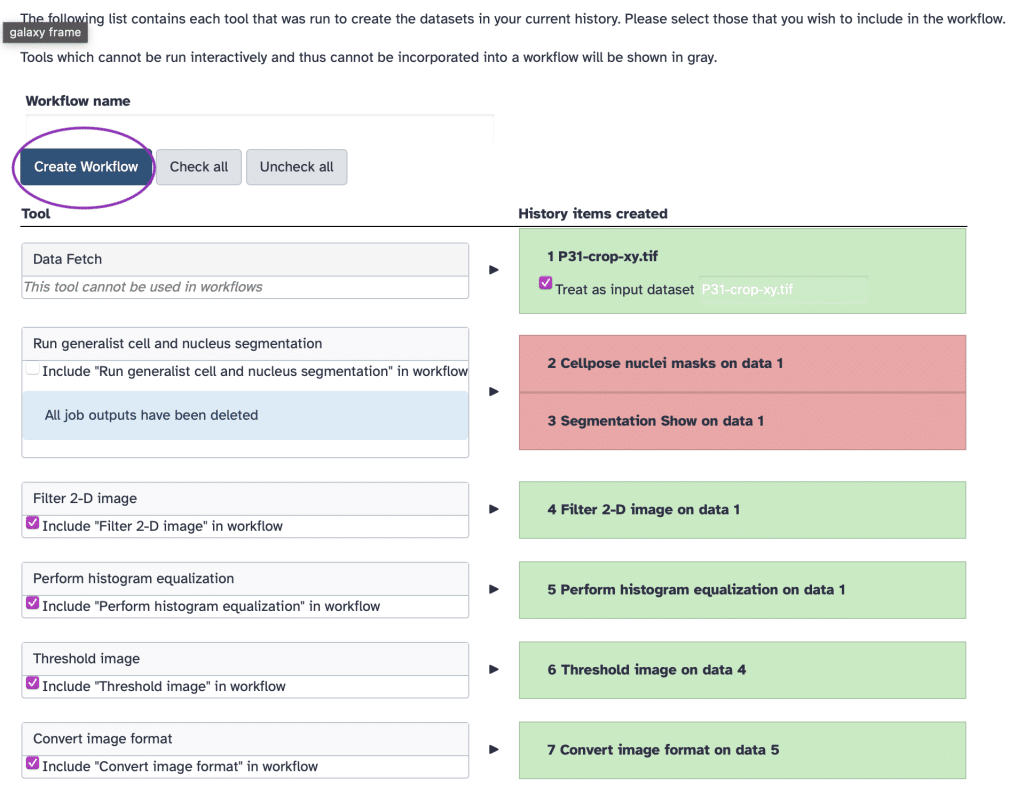
In this way, we can create workflows and easily integrate them with workflows made by others (but always check the licensing if you want to use someone else’s work).
CellProfiler
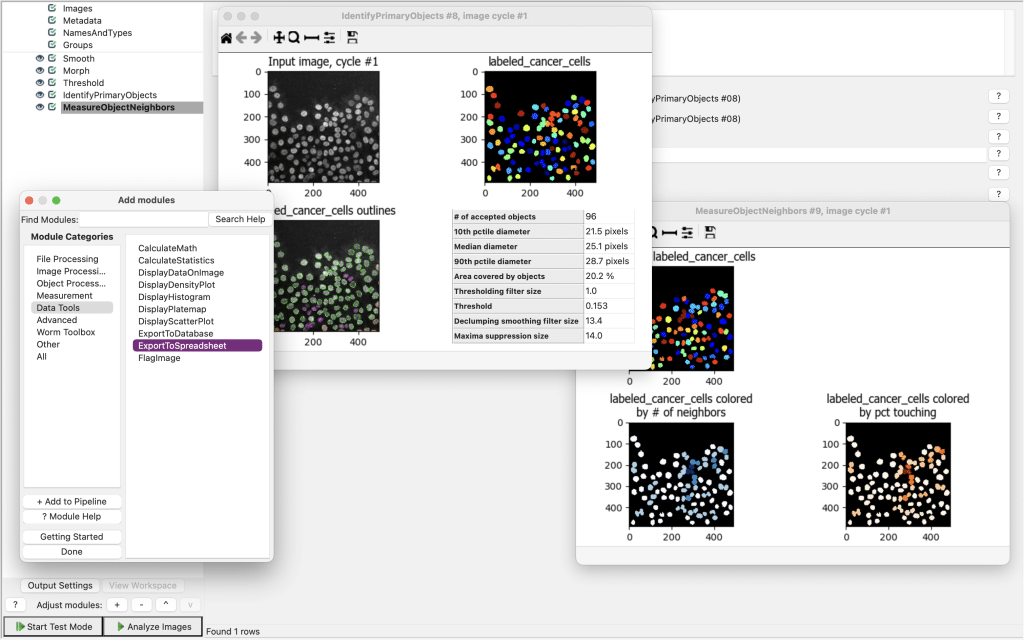
CellProfiler is another widely used software platform to build customizable pipelines of microscopy images. If you need some help getting started on how to build a pipeline with Cellprofiler, here is a quick video tutorial. Basically, once you built your pipeline, you can find an option called ExportToSpreadsheed under the Data Tools module:
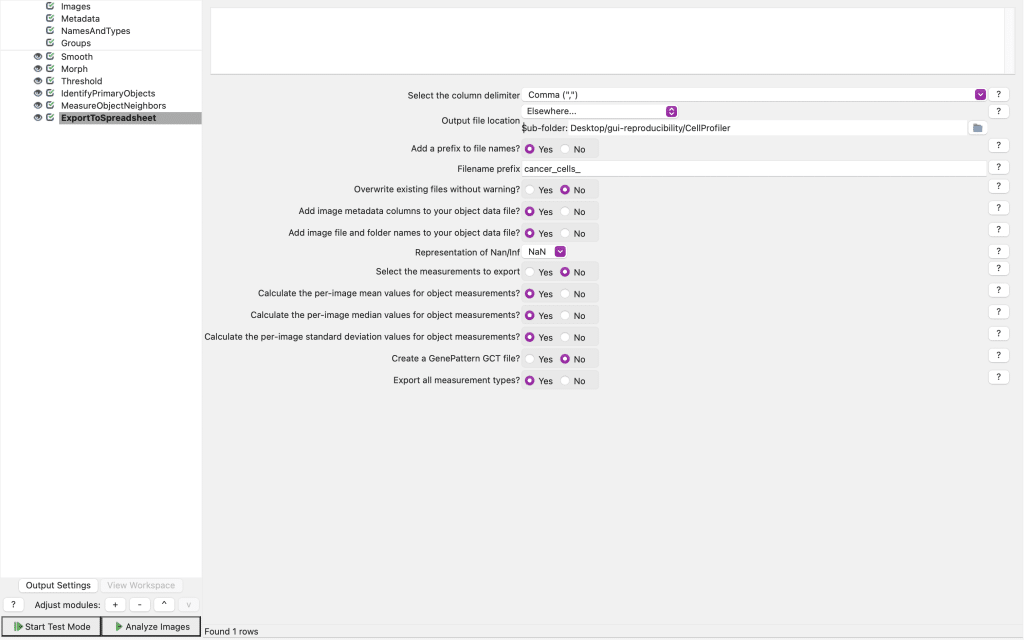
If you select this, you can specify exactly where and how the csv-files with all the parameters and measurements should be saved:
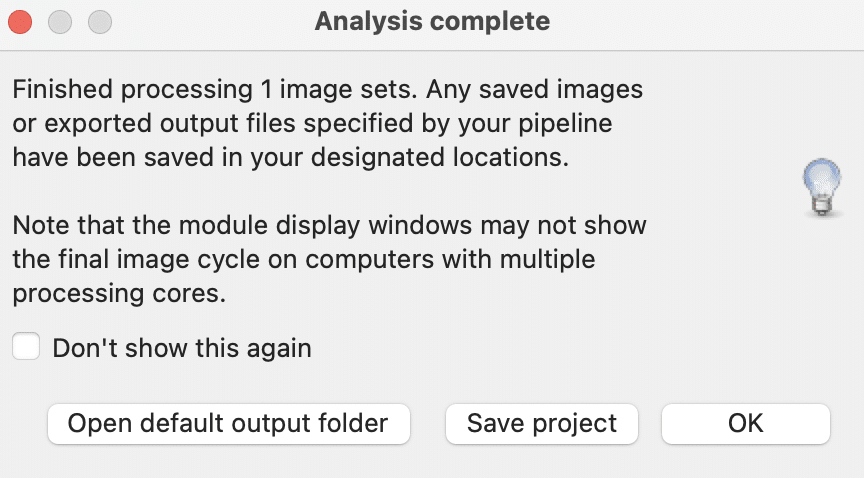
CellProfiler also allows you to save your project (which includes your pipeline) via File > Save Project:
Pipelines are saved as .cpproj files:
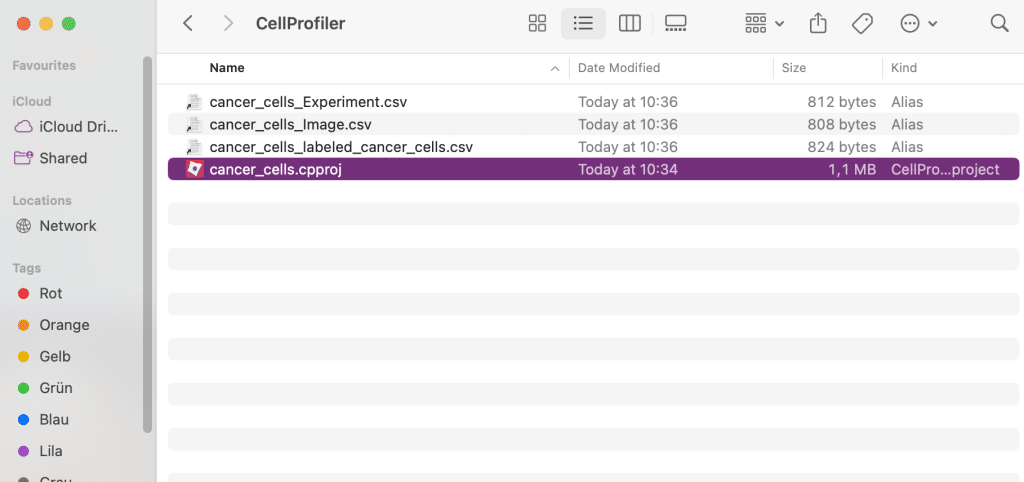
These files store the sequence of image processing modules, all parameter settings for the different modules as well as input/output configurations, including image sources and measurements.
JIPipe
Last but not least, let’s have a look at JIPipe (= Java Image Processing Pipeline). JIPipe is a visual programming environment for bio-image analysis built on ImageJ, enabling users to create, run, and share complex analysis workflows.
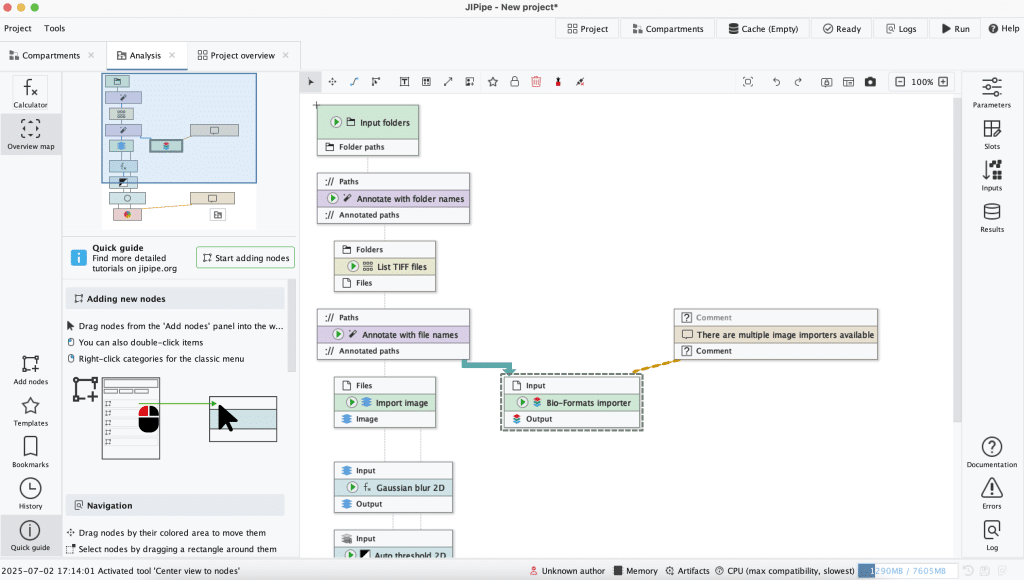
Example workflow in JIPipe which can be found under Getting started, Examples, Example: Loading and processing an image.
The workflows are saved as project files with the extension .jip. These files contain the full visual workflow graph (with nodes and data flow) as well as all parameters and settings for the different processing steps. Also the metadata including descriptions, version info and dependencies are stored.
Comparing the tools in terms of reproducibility
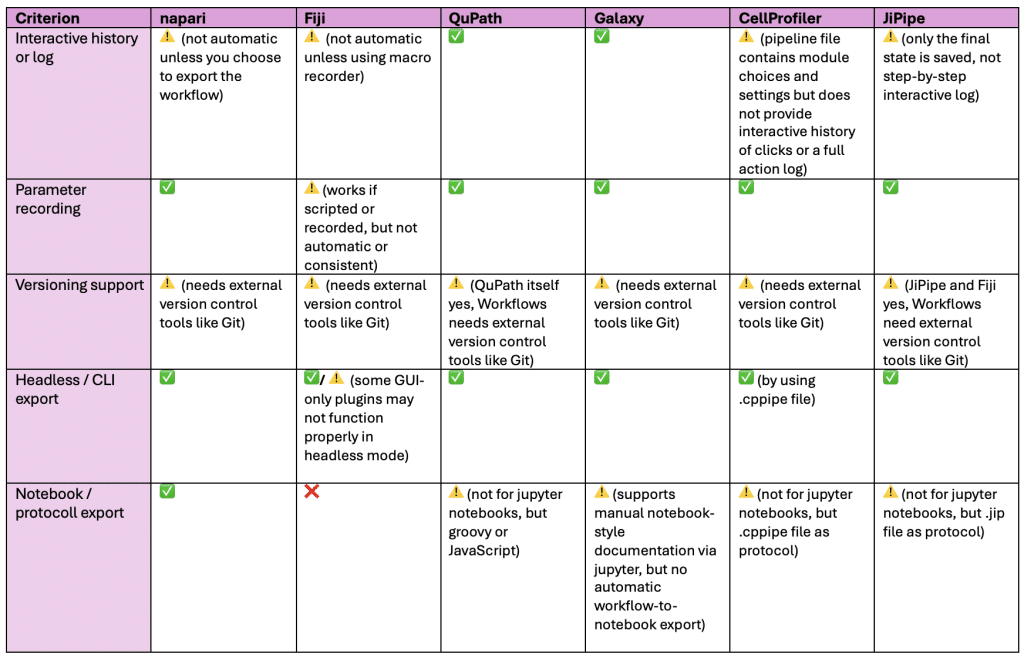
- Interactive history or log = Are user interactions (clicks, settings, modules used) saved somehow?
- Parameter recording = Does the tool store all parameters / settings used in a session or pipeline?
- Versioning support = Can the workflow be version controlled (e.g. record software version, plugin version)?
- Headless / CLI export = Can the GUI-generated workflow be run without GUI (e.g. command-line or script)?
- Notebook / protocoll export = Can the workflow be exported as jupyter notebook, protocol or documentation for sharing / publishing?
More platforms / tools
Take home messages
- There are so many ways to save workflows, also in GUIs. Use them to save and share your workflow – not just your results! This way your analysis can be shared, repeated, or even automated later.
- Consider exploring the tools yourself to identify not only which ones are most intuitive for quick analysis, but also which support long-term reproducibility for your projects.
Further considerations
- Version control, such as in GitHub, is crucial for saving your bio-image analysis workflows because it enables you to track changes, collaborate effectively, and ensure reproducibility by preserving a clear history of the exact code and parameters used at each stage of your analysis. You can read more here.
- Using containers is a good way to ensure reproducible environments and avoid “It worked on my machine.” issues.
For conda this can be done by sharing an environment.yml file and when using Docker containers, the Dockerfile can be shared. Related to this topic is also this poster on long-term reproducibility of image analysis results on ImageJ and Fiji by Dr. Robert Haase et al. which outlines the change of ImageJ and Fiji GUI over the years.
Further reading
- “QuPath: Taking full control through workflows, scripting, and extensions” blog post by Olivier Burri
Feedback welcome
Some of the packages used above aim to make intuitive tools available that implement methods, which are commonly used by bioinformaticians and Python developers. Moreover, the idea is to make those accessible to people who are no hardcore-coders, but want to dive deeper into Bio-image Analysis. Therefore, feedback from the community is important for the development and improvement of these tools. Hence, if there are questions or feature requests using the above explained tools, please comment below or open a thread on image.sc. Thank you!
Acknowledgements
I want to thank all the developers behind the tools shown in this blogpost:
- napari: see contributor list on napari GitHub repository (licensed BSD-3)
- napari-assistant: Dr. Robert Haase, Ryan Savill, Dr. Peter Sobolewski (licensed BSD-3)
- napari-workflows: Dr. Robert Haase, Ryan Savill, Dr. Till Korten, Dr. Pradeep Rajasekhar, Dr. Johannes Soltwedel (licensed BSD-3)
- Fiji: see contributor list on Fiji GitHub repository (licensed GPL-3.0)
- QuPath: see contributor list on QuPath GitHub repository (licensed GPL-3.0)
- Galaxy: see contributor list on Galaxy GitHub repository (licensed MIT)
- CellProfiler: see contributor list on CellProfiler GitHub repository (licensed BSD-3)
- JIPipe: Applied Systems Biology Lab, HKI Jena (licensed MIT)
Many thanks to Dr. Robert Haase and Lea Kabjesz for their input on this blog post.
The author acknowledges the financial support by the Federal Ministry of Education and Research of Germany and by Sächsische Staatsministerium für Wissenschaft, Kultur und Tourismus in the programme Center of Excellence for AI-research „Center for Scalable Data Analytics and Artificial Intelligence Dresden/Leipzig“, project identification number: ScaDS.AI.
Reusing this material
This blog post is open-access, figures and text can be reused under the terms of the CC BY 4.0 license unless mentioned otherwise.
 (2 votes, average: 1.00 out of 1)
Write a ‘How to’ post
Create an account or log in to post your story on FocalPlane.
More posts like this

Filter by
- NewsApply
- DiscussionsApply
- How toApply
- ToolsApply
- Case studiesApply
- InterviewsApply
- JobsApply
- EducationApply
- Blog seriesApply
- Volume EMApply
- Latin American Micro..scopistsApply
- Bio-image Analysis w..ith NapariApply
- Imaging with…Apply
- Towards Global Acces..sApply
- Latin America Bioima..gingApply
- From Zero to Qupath ..HeroApply
- Asian Microscopists ..and Cell BiologistsApply
- AIC at HHMI JaneliaApply
- Deep Learning for Bi..o-image analysisApply
- GloBIAS – updates fr..om the communityApply
- WAMBIAN: West Africa.. in FocusApply
- Highlights from Euro..-BioImagingApply
- LSFM seriesApply
- DIY MicroscopyApply
- View all