How do I get started with image analysis?
Posted by Rachel Lee, on 15 December 2025
by Owen F. Puls and Rachel M. Lee
Microscopy is a powerful observational tool and, when used carefully, a rich source of quantitative information. Indeed, journals and reviewers increasingly expect quantitative results from microscopy experiments. And yet, it can be difficult to know where to get started with image analysis, given the abundance of tools and techniques that are available. As of this blog post, the BioImage Informatics Index (https://biii.eu/), which keeps track of image analysis tools, lists over 1400 pieces of software!
Fear not: the key first step when getting started with image analysis is not to fully learn thousands of software tools, but rather to think ahead and critically consider biological questions and experimental design. Experimental design in microscopy is not linear. Each step—from the initial hypothesis to sample preparation; from image acquisition to analyzing the data—influences the results of every other step. You are familiar with this back-and-forth if you’ve ever tried to determine which fluorescent label is best for your sample: imaging provides feedback on your labeling, which is then improved to design better imaging. The same type of feedback often holds true for image analysis. As a result, the best time to think about your analysis plans is before you even start preparing samples (Wait et al., 2020) (and, as the saying goes, the second-best time is now). Quantitative analysis ultimately provides the results that tackle your biological question. It is paramount that this analysis is derived from experiments and images designed with sound and informative analysis in mind.
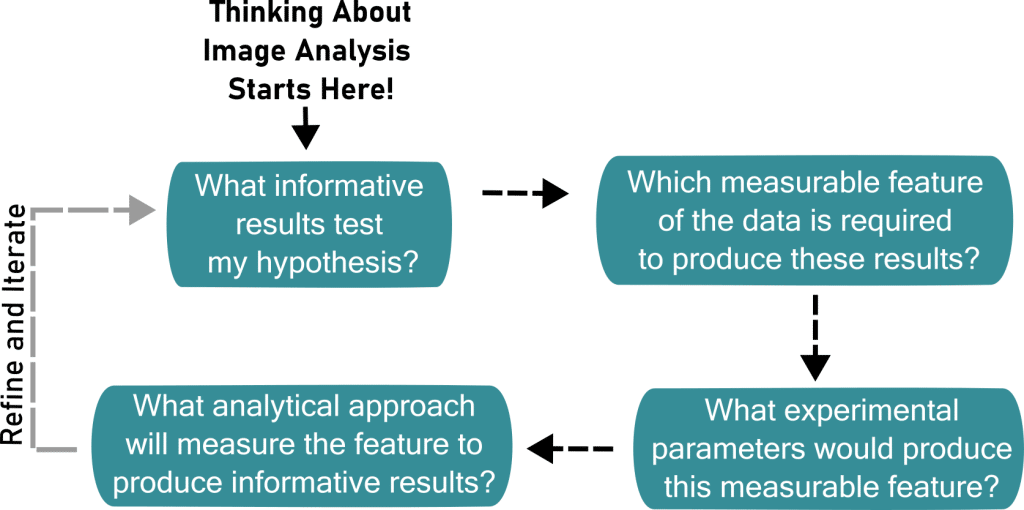
One beautiful aspect of microscopy data is that each image contains a wealth of information. However, this wealth can sometimes be distracting. To remedy this, the very first step in developing an image analysis workflow is to determine what you need to measure to answer your biological question. In other words, what result would support or refute your hypothesis? For example, if your hypothesis states that some protein is recruited to the cell membrane after treatment, then your analysis plan ultimately boils down to asking: “does the amount of protein on the membrane increase post-treatment?” To answer this question, your experiment must be designed to produce a readout of protein quantity “on” and “off” the membrane. In general, aim to make your hypothesis as specific and quantitative as possible. This will reduce any ambiguity between the result and how it addresses your question.
After determining what biological readout to measure, you then need to determine what quantity you can measure in your images to provide this result. In essence, what feature of your image data can you leverage to address your hypothesis? If your hypothesis is that the protein integrates into the membrane, you could measure the intensity of a label. This could be used to measure the amount that the protein colocalizes with the membrane compared to a control. Alternatively, the hypothesis may be that the protein is recruited closer to, but not directly on, the membrane. To address this question, you could use spatial localization to measure the relative distance between the protein and membrane (in this case, a smaller average distance post-treatment would support recruitment). Whatever the approach or specific metric used, the key is to make sure that your measurement will address your hypothesis or biological question. There is no need to focus on software tools for co-localization if spatial distribution would be more informative, and vice versa.
Once you establish the “what” of your analysis workflow, the task now shifts to the “how” of the matter. This takes two forms: the experimental and the analytical. Let’s begin with the experimental side of things. “What” needs to be measured obviously informs the choice of imaging modality, resolution, labelling, and more. In our example, we need to label both our protein of interest and the membrane with distinguishable dyes or fluorophores. A specific hypothesis is key for determining which microscope hardware is necessary for imaging. Does the biological question require high enough resolution to determine if the protein is incorporated into the membrane? Or simply enough resolution to see a shift in localization from the bulk of the cytoplasm to the cell edge?
At this point, you’ve designed a quantitative and specific imaging experiment to test your hypothesis, which is a big step forward! While you begin acquiring images, troubleshooting fluorescent labels, and otherwise optimizing your quantitative experimental design, you can also begin to address the second, analytical “how” by looking for software tools that can measure your desired image feature(s). You may be able to use existing tools like ImageJ/FIJI (Schindelin et al., 2012), CellProfiler (Stirling et al., 2021), or CellPose (Stringer and Pachitariu, 2025), or you may need to develop a custom approach using Python or other programming languages. In many cases, searching existing publications for your desired metric or image features can help narrow down the search to just a few tools that can be tested in more depth. Understanding a few basic principles of your image (see for example, Introduction to BioImage Analysis, https://bioimagebook.github.io/index.html) can also help you narrow down what tools might be helpful for your approach.
If you are not used to thinking about quantitative imaging processing, it can feel odd to start with these conceptual analysis questions before ever heading to the microscope. However, practicing quantitative experimental design can save time in the lab and produces more informative biological results. Spending time on careful experimental design can also help you communicate your analysis needs to a bioimage analyst or other expert—this will be a topic for an upcoming blog post. In the meantime, careful consideration of the quantification your biological question needs puts you on a great path to ultimately analyzing your images and testing your hypothesis.
References
Schindelin, J., Arganda-Carreras, I., Frise, E., Kaynig, V., Longair, M., Pietzsch, T., Preibisch, S., Rueden, C., Saalfeld, S., Schmid, B., et al. (2012). Fiji: an open-source platform for biological-image analysis. Nat Methods 9, 676–682.
Stirling, D. R., Swain-Bowden, M. J., Lucas, A. M., Carpenter, A. E., Cimini, B. A. and Goodman, A. (2021). CellProfiler 4: improvements in speed, utility and usability. BMC Bioinformatics 22, 433.
Stringer, C. and Pachitariu, M. (2025). Cellpose3: one-click image restoration for improved cellular segmentation. Nat Methods 1–8.
Wait, E. C., Reiche, M. A. and Chew, T.-L. (2020). Hypothesis-driven quantitative fluorescence microscopy – the importance of reverse-thinking in experimental design. J Cell Sci 133.
 (1 votes, average: 1.00 out of 1)
Get involved
Create an account or log in to post your story on FocalPlane.
More posts like this


Filter by
- NewsApply
- DiscussionsApply
- How toApply
- ToolsApply
- Case studiesApply
- InterviewsApply
- JobsApply
- EducationApply
- Blog seriesApply
- GloBIAS – updates fr..om the communityApply
- Volume EMApply
- Latin American Micro..scopistsApply
- Bio-image Analysis w..ith NapariApply
- Imaging with…Apply
- Towards Global Acces..sApply
- Latin America Bioima..gingApply
- From Zero to Qupath ..HeroApply
- Asian Microscopists ..and Cell BiologistsApply
- AIC at HHMI JaneliaApply
- Deep Learning for Bi..o-image analysisApply
- Highlights from Euro..-BioImagingApply
- LSFM seriesApply
- DIY MicroscopyApply
- View all