Imaging spotlight: Calibrating expansion microscopy to map receptor sorting domains in endosomes
Posted by FocalPlane, on 15 April 2026
In this behind the paper story, Tayla Shakespeare and Izzy Jayasinghe share their research mapping receptor sorting domains in endosomes using expansion microscopy (ExM). As part of this research, they developed a calibrated 3D ExM toolkit to measure local expansion.
What are the key results from your paper?
One of the enduring challenges in cell biology is that some of the most important decisions a cell makes happen on structures that are simply too small for conventional light microscopy, yet too difficult to capture comprehensively in 3D with most super-resolution methods. Endosomes are a good example – they are nanoscale intracellular compartments that receive internalised receptor complexes and direct them towards either recycling or degradation, regulating intracellular signalling and cell homeostasis. For receptors such as epidermal growth factor receptor-1 (EGFR1), these decisions are governed by how receptors, signalling proteins, and membrane domains organise on the endosome surface, forming three-dimensionally complex topologies.
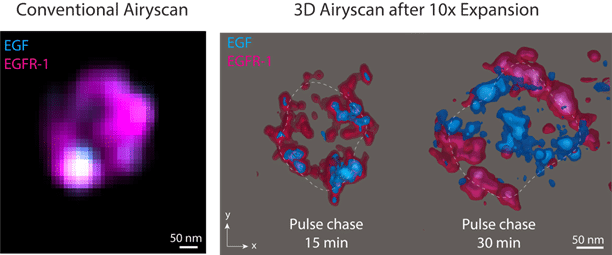
We wanted to understand how nanodomains that define endosome maturation govern EGFR1 sorting, but we were faced with the experimental challenge that endosomes are not only very small, but also crowded, dynamic and heterogeneous. Expansion microscopy (ExM) offered a very exciting opportunity for us – it gave us a way to look at the geometry of the whole organelle and resolve where different protein nanodomains and the receptor complex sat relative to the limiting membrane and to one another at different stages of sorting. We applied a calibrated 10-fold ExM approach with multiplexed 3D Airyscan microscopy and pulse-chase internalisation of fluorescent EGF to examine EGFR1 sorting at 15 or 30 minutes after internalisation.
Our workflow allowed us to map the complex topologies of protein nanodomains within the endosomal volume, revealing progressive redistribution of EGF and EGFR1 into spatially distinct sub-compartments with a level of 3D precision not accessible with conventional imaging. Equally striking was the spatial partitioning between regulatory machinery and cargo: Rab5a concentrated near the limiting membrane while EGF and EGFR1 accumulated in the endosomal interior. Together, this supports a picture where endosome maturation involves coordinated shifts in both cargo localisation and the membrane-proximal machinery defining endosomal identity. Importantly, our results demonstrate the capabilities of ExM to resolve key events in endosome biology, while also highlighting the necessity for proper calibration of hydrogels when applying this technique.
Can you describe the calibrated 3D ExM toolkit that you developed as part of this research?
ExM is frequently described in terms of a global expansion factor, and too often relies on the assumption that the whole sample expands evenly. In reality, small intracellular regions are not guaranteed to expand perfectly uniformly – and that matters enormously when the structure you care about is only a few hundred nanometres across before expansion. Even a modest local error in expansion can translate into a large error in the estimated size of an organelle, the thickness of a membrane-associated domain, or the distance between two proteins.
We built a 3D distortion analysis based on the Farneback optical-flow principle, which allowed us to detect anisotropies in hydrogel expansion, and revealed that cytoplasmic regions containing endosomes could be under-expanded within ExM hydrogels, leading to systematic overestimation of size and distance measurements for small protein-rich compartments such as endosomes.
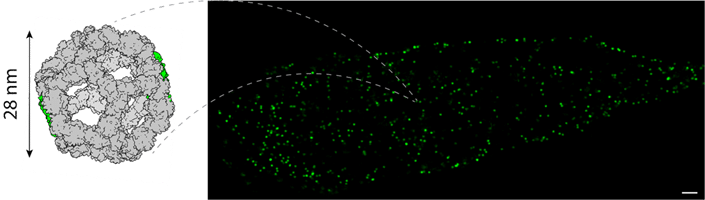
Such heterogeneity in local expansion is not unexpected. Key steps such as protein target-to-gel cross-linking (a step known as ‘anchoring’), gel infiltration, and denaturation of the sample can be sub-optimal in confined spaces such as intracellular or intraluminal endosomal structures. To address this, we introduced a self-assembling protein nanocage as a local nanoscale calibrant: a structure of known dimensions embedded in the same cytoplasmic environment as the organelles we wanted to measure, reporting the true local expansion factor rather than a bulk average. For this, we paired a 28-nm wide decahedral nanocage, developed by Prof David Baker and team, with 10x ExM. The elegant, self-assembling nature of the nanocage meant that we could transfect the cells of interest with the gene and observe fully-assembled nanocages in the cytoplasm (Figure 2). Measuring the width of these stereotypic nanocages in post-ExM images allowed us to directly estimate the local expansion factor, hence translate the features observed around endosomes to a true biological length scale. Being able to measure intrinsic expansion factor proved to be crucial and shifted the study. Rather than simply using ExM as a visualisation technique, we could ensure that the spatial measurements performed with this data had an intrinsic calibration of how protein-rich structures underwent expansion.
You also developed a volume reconstruction pipeline to allow you to map nanodomains onto the endosomal membrane, can you tell us about that?
A key question of the investigation was, ‘how extensive is the organisation of EGF/EGFR1 nanodomains and the area of the endosomal limiting membrane that interacts with some of the signalling molecules such as Rab5a?’ To address this, we needed a reference to the overall 3D topology of the endosome’s outer surface. The paper demonstrates a few distinct ways of fluorescently staining endosomal surfaces in combination with ExM. These strategies range from immunostaining well-known endosomal epitopes – early endosomal antigen-1 (EEA1), hepatocyte growth factor-regulated tyrosine kinase substrate (Hrs), and endosome-associated FYVE-domain protein (Endofin) – to a GFP probe targeted to phosphatidylinositol 3-phosphate (PI3P) and ExM-compatible, endosome-specific NHS esters. Whilst these labelling strategies demarcate the limiting membrane, the nanoscale resolution means that labelled targets often appeared either punctate or patchy.
The surface tracing tool performs a mathematical localisation of labelled puncta or patches on the expanded endosome surface and a series of iterative triangulation transformation of these coordinates creates a smooth, and highly detailed surface of the endosomes. We were then able to project any protein nanodomain near the endosome’s limiting membrane onto this surface.
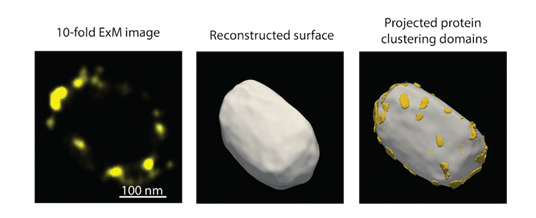
The method works well for relatively compact and rounded organelles and should be transferrable to other types of intracellular compartments. Perhaps more importantly, this method demonstrates the powerful, 3D visualisations enabled by the 3D super-resolution that is on offer with ExM.
What are the prospects for further development for your methodology?
Our nanocage calibrant offers a way to measure nanoscale intracellular expansion in regions local to a biological structure of interest. However, the sub-30 nm size of the calibrant means that out-of-focus fluorescence from the top and bottom edges of the nanocage obstructs resolution of its central cavity, even after 10-fold expansion. Applying a radial symmetry-based method such as eSRRF (enhanced super-resolution radial fluctuations) after imaging could help resolve this cavity, providing shape information that reveals local nanoscale anisotropies in expansion within the hydrogel.
Refinements to this approach will continue to come through. For example, more compact molecular probes and more versatile hydrogel chemistries as well as calibration methods will make the uptake of ExM easier in this area of research.
Are there technical tips or tricks that you learnt while doing this research?
When performing ExM experiments, it is important to ensure reagents are stored appropriately and guidelines are followed to ensure gel polymerisation. It is important to recognise that multiple factors can affect the apparent macroscale expansion factor, such as cell confluency, or choice of fixation reagent, but this doesn’t necessarily reflect true intracellular expansion within the sample. A broader message of the paper is that ExM is incredibly powerful, but it should not be treated as automatically quantitative just because the formulation of the hydrogel chemistry promises a certain expansion factor. The more we try to use ExM to measure small organelles and nanoscale protein assemblies, the more important it becomes to benchmark local expansion, detect distortions and validate the geometry that we reconstruct. Tools that we and others have developed to restore the quantitative reliability of post-ExM data will increasingly become critical for interpreting and the reproducibility of such datasets.
Shakespeare T, Seehra RS, Flores Rodriguez N, Atuanya N, Sheard TMD, Köhler R, Bose D, Wunderley L, Woodman P, Ciani B, Jayasinghe I. Mapping Epidermal Growth Factor Receptor-1 Sorting Domains in Endosomes with a Calibrated Three-Dimensional Expansion Microscopy Toolkit. ACS Nano. 2026 Mar 31;20(12):10074-10089. doi: 10.1021/acsnano.6c00277. Epub 2026 Mar 16. PMID: 41840347; PMCID: PMC13045352.
 (No Ratings Yet)