

Imaging spotlight: FOCUS-3D
Posted by FocalPlane, on 10 September 2026
In this Imaging spotlight, Qinghua Zhang, Joaquín Navajas Acedo, Guoqiang Yu and team introduce FOCUS-3D, a tool for segmenting cells from 3D fluorescence microscopy images. We learn what’s different about FOCUS-3D and how the researchers made it useful and usable for a wide-range of biologists.
What is FOCUS-3D and what’s new compared to other segmentation tools?
FOCUS-3D is an AI tool for detecting and segmenting individual cells in three-dimensional fluorescence microscopy images. The goal is simple: we wanted to empower researchers to efficiently explore their valuable 3D microscopy datasets with accurate cell segmentation by running the model off‑the‑shelf in our integrated platform.
Compared to existing approaches, one important difference is that FOCUS-3D was designed natively for 3D data. Many widely used general-purpose tools were originally developed for 2D images. When they are applied to 3D microscopy, they often segment individual image planes and then try to connect the results across the Z direction. That approach can work well, but it does not really treat the cell as one continuous three-dimensional object.
FOCUS-3D instead looks at the volume directly. In other words, a cell is seen as a 3D object rather than a stack of separate 2D shapes. This becomes particularly useful when cells touch each other, boundaries are weak in some Z-planes, or cell shapes are complex. We wanted to help cell biologists, developmental biologists and system biologists answer their exciting questions by creating an analysis tool that would work across different models, using different setups. So, unlike many 3D models developed for a particular dataset or imaging setup, FOCUS-3D was built with the aim of working directly across very different types of microscopy data. Ultimately, we want 3D cell segmentation to become something researchers can simply use, rather than a new machine-learning project they have to start for every dataset.
The other strength of FOCUS-3D is that it is fast, even with large datasets. So, if you or your lab are studying questions that require measuring cellular properties, FOCUS-3D will be perfect and will save you a lot of time.
How long did it take to manually annotate your training dataset of more than 410,000 3D cell instances, and why was this so important?
Building this dataset required over 2,000 hours of expert human annotation and correction, assisted by our newly developed annotation tool. Importantly, we did not draw every cell completely from scratch. We started from preliminary segmentations produced by unsupervised methods, existing algorithms, or previously available silver-standard annotations —that is, automatically generated annotations that had not yet undergone rigorous manual correction-, examined the initial results one by one and then conducted manual correction. Creating 410,000 high-quality 3D cells entirely from scratch would be extremely difficult, as we estimated that it would require tens of times more time and effort.
This is one of the reasons general-purpose 3D segmentation has lagged behind 2D segmentation. In 2D, large annotated image datasets are relatively common. In 3D microscopy, annotation is much harder: you have to move through many Z planes and constantly judge whether structures in neighboring slices belong to the same cell. High-quality public 3D annotations are therefore still surprisingly scarce.
For FOCUS-3D, we assembled data from both public resources and datasets generated by our group and collaborators. They cover very different biological systems, including zebrafish, Drosophila, mouse, C. elegans, plants, fungi, and in vitro models with different tissues, fluorescent labels and imaging conditions. Our annotated dataset portal contains 14 dataset families and more than 410,000 annotated 3D instances. When combined with existing high-quality public annotations, this brings the total number of annotated cells used in FOCUS-3D to over 460,000.
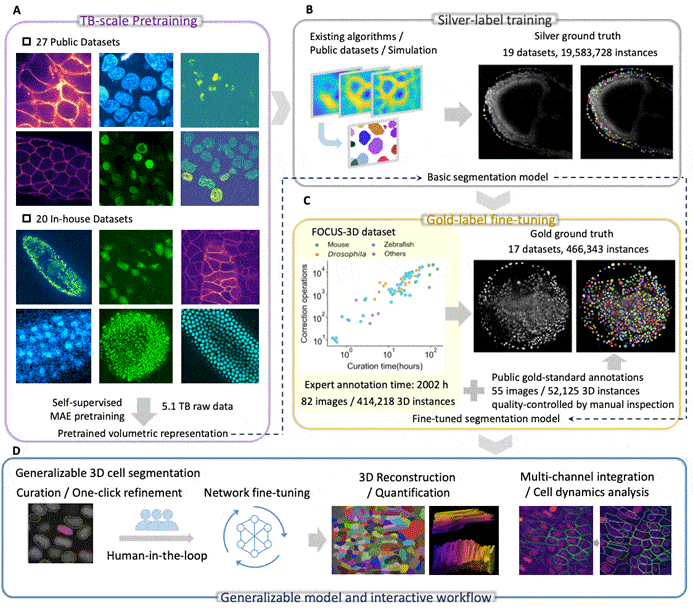
We also tried to make much better use of data that are not perfectly annotated. Before training on the carefully curated “gold-standard” cells, we trained FOCUS-3D on nearly 20 million “silver-standard” cell instances generated automatically by existing segmentation methods. In very simple terms, we let the model first learn from a huge amount of imperfect information and then teach it more carefully using a smaller amount of very high-quality information. We also pretrained it on about 5.1 TB of unlabeled 3D microscopy data, helping the model learn general visual patterns from a much broader range of biological images before seeing any manual annotations. This combination turned out to be extremely valuable.
The development of FOCUS-3D also highlights why making imaging data FAIR—findable, accessible, interoperable and reusable—is so important. An imaging dataset collected for one biological question can later help researchers develop a completely different analysis method. Public imaging data allowed us to build something much broader than we could have produced within a single laboratory. Ideally, the datasets and models we release will contribute to the same cycle: other researchers can reuse them, improve them and eventually contribute new types of data back to the community.
What has FOCUS-3D been used for so far?
Our main biological application so far has been studying zebrafish development and morphogenesis.
We used FOCUS-3D to segment cells in live 3D imaging of the developing zebrafish notochord. If you have ever imaged zebrafish embryos, you’d know how dynamic and fast everything is, so we were particularly thrilled to challenge FOCUS-3D in these conditions. We also leveraged our recently developed ITEC algorithm, which can track cells accurately across many datapoints in large 3D datasets. Because we could obtain cell boundaries throughout the tissue and throughout development, we were able to measure how individual cells moved, changed shape and reorganized with their neighbors.
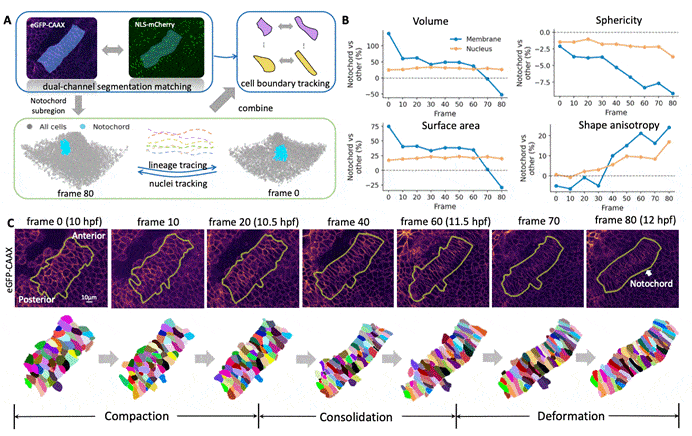
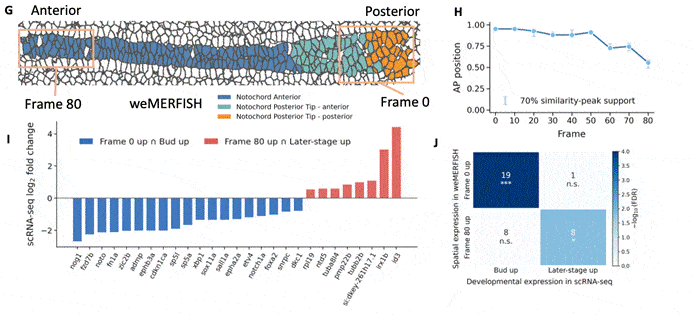
This revealed three successive stages of early notochord development. Early on, much of the change comes from cells moving and rearranging. Later, cell shape changes and the way cells pack together become increasingly important. We were then able to compare these morphological states with independent spatial gene-expression data (https://schier.merfisheyes.com/), connecting what the cells look like and how they behave with their developmental state. This approach can become a gold mine for people trying to understand the gap between transcriptome and phenotype, and how much (or not) one explains the other.
More broadly, most of our carefully annotated training data came from developmental imaging systems such as zebrafish, Drosophila, mouse and C. elegans. However, the much larger unlabeled pretraining collection was considerably more diverse. Interestingly, we found that the model could also work well on some biological systems for which we had never provided manual annotations. That does not mean FOCUS-3D can segment every possible 3D biological structure. But for images where nuclei or cell membranes are fluorescently labeled, we have found that its ability to transfer between datasets can be strong.
What other systems do you expect it to translate to? Are there systems or models that it might struggle with?
We think the most natural applications are other 3D fluorescence microscopy experiments where researchers want to identify individual nuclei or whole cells. That could include embryos from other species, organoids, spheroids, cultured cells, plant tissues and many other volumetric imaging experiments.
An encouraging point is that FOCUS-3D has already been tested across different species, tissues, fluorescent reporters and imaging conditions, including data different from the datasets used for its final training.
At the same time, we do not want to suggest that one model can solve every microscopy problem. FOCUS-3D can still struggle when cell boundaries are extremely weak or discontinuous, when neighboring cells are packed so densely that there is almost no visible boundary between them, when fluorescence intensity varies dramatically, or when the size and appearance of the objects are very different from anything represented in the training data. It is also primarily designed around nuclei and membrane-defined cells rather than arbitrary structures such as every possible organelle.
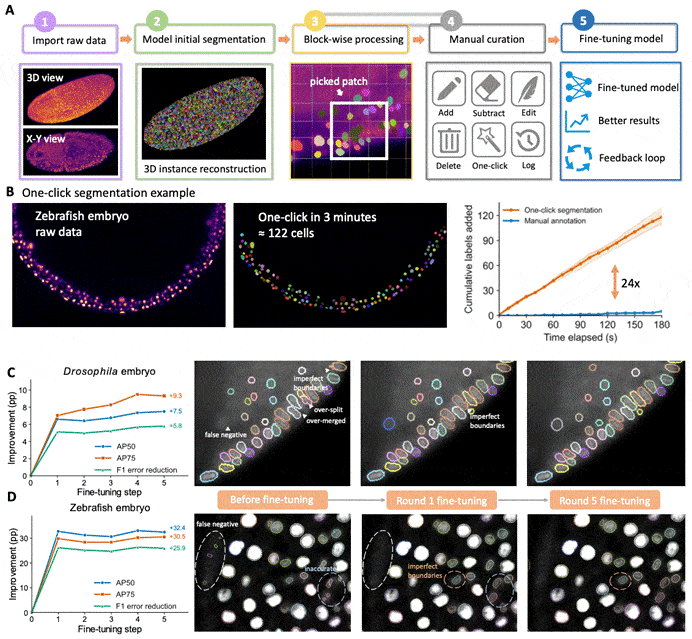
In those more unusual cases, the pretrained model can still provide a useful starting point. Researchers can correct a relatively small amount of their own data and then fine-tune FOCUS-3D rather than building a segmentation model completely from scratch.
What do researchers require to implement it? Can I work with this on my laptop or desktop?
Yes! Making FOCUS-3D easy to use has been one of our two priorities (the other is accuracy), because a segmentation model is not very useful if only AI specialists can install and run it.
There are currently two particularly straightforward ways to use it.
The easiest is FOCUS-3D Online, which currently runs through Hugging Face. For relatively small datasets, users can simply upload a 3D TIFF file in a web browser, choose whether they are segmenting nuclei or membranes, and run the model remotely. At most, we ask for very intuitive information such as an approximate cell radius and background intensity. The result can be inspected directly online and downloaded afterward. This means that you do not need your own GPU just to try the model.
For regular use or larger datasets, we provide a napari plugin. This gives researchers more than automatic segmentation. They can inspect the 3D result, manually correct errors, perform one-click local segmentation, prepare corrected examples for fine-tuning, reconstruct individual cells and calculate quantitative measurements such as cell morphology and neighborhood relationships—all within the same platform.
So yes, FOCUS-3D can be used from a laptop or desktop. If you simply want to test your data, the online version is the easiest route. For local processing of larger volumes, a computer with an NVIDIA GPU is required. Fine-tuning the model is more computationally demanding than simply running the pretrained model, but we also provide the original training and fine-tuning code for groups that want to adapt FOCUS-3D to their own data.
What are the prospects and needs for further development?
There are several directions that we are particularly excited about.
The first is more diverse data. The current model already benefits enormously from combining public data, in-house data, unlabeled images, automatically generated labels and carefully curated annotations. We hope that releasing both the model and our annotated datasets will encourage more researchers to try FOCUS-3D and, ideally, contribute examples from biological systems that are currently missing. This could create a positive cycle: a more diverse community produces more diverse data, and more diverse data produce a model that works for a broader community.
The second direction is connecting segmentation with cell tracking. A 3D image tells us where the cells are at one moment, but live imaging tells us how those cells move, divide and change over time. We have already been working on connecting FOCUS-3D with our cell-tracking framework, ITEC. In the future, we think segmentation and tracking should not simply be two independent steps. Information from neighboring time points could help correct segmentation errors, while better segmentation could in turn produce better tracks. Ultimately, this could make long-term reconstruction of developing tissues much more reliable.
More generally, we see segmentation as the beginning rather than the end. Once individual cells can be reliably identified in 3D and over time, we can start asking much richer biological questions about cell shape, movement, lineage, neighborhood, tissue organization and eventually how all these properties relate to molecular state.
Where can people find more information?
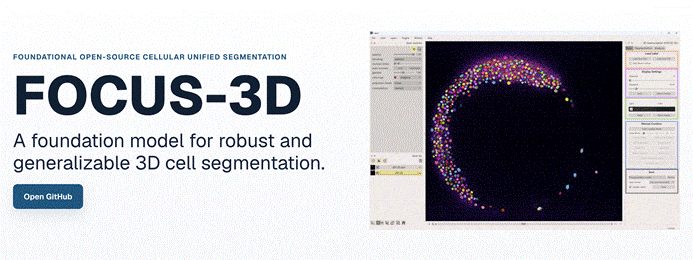
The main entry point is the FOCUS-3D website, where we provide examples, datasets and documentation.
The GitHub repository contains the open-source software, installation instructions, napari plugin workflow and fine-tuning code.
For people who simply want to try FOCUS-3D on their own images without installing anything, the Hugging Face Space provides an online version.
And for the full scientific background, benchmarking and biological applications, the FOCUS-3D bioRxiv preprint describes the work in detail. Finally, if you have any questions about using FOCUS-3D, would like to explore adapting the model to your own data, or are interested in collaboration, please contact us at yug(at)tsinghua.edu.cn or joaquin(at)navajasacedo.proton.me.
Get involved
Create an account or log in to post your story on FocalPlane.
More posts like this

Filter by
- NewsApply
- DiscussionsApply
- How toApply
- ToolsApply
- Case studiesApply
- InterviewsApply
- JobsApply
- EducationApply
- Blog seriesApply
- Bio-image Analysis w..ith NapariApply
- Imaging with…Apply
- Towards Global Acces..sApply
- Latin America Bioima..gingApply
- From Zero to Qupath ..HeroApply
- Asian Microscopists ..and Cell BiologistsApply
- AIC at HHMI JaneliaApply
- Deep Learning for Bi..o-image analysisApply
- GloBIAS – updates fr..om the communityApply
- WAMBIAN: West Africa.. in FocusApply
- Volume EMApply
- Latin American Micro..scopistsApply
- Highlights from Euro..-BioImagingApply
- LSFM seriesApply
- DIY MicroscopyApply
- View all